"Never short a dull market" is an old trader saying that aptly describes where we are right now, and let me add they're not the easiest markets to write about either.
There are always individual opportunities to discuss, but asset markets as a whole are stuck in a grey zone. The reflation trade – outperformance of economically cyclical stocks at the expense of conservative, credit-sensitive sectors such as utilities and consumer staples – that began in July, 2016, and intensified after the U.S. election – has been widely unwound. But the downward momentum for cyclical sectors has also slowed and it feels like most stocks are now just treading water in search of direction.
Below are three charts I'm following to gauge where and when markets will break.
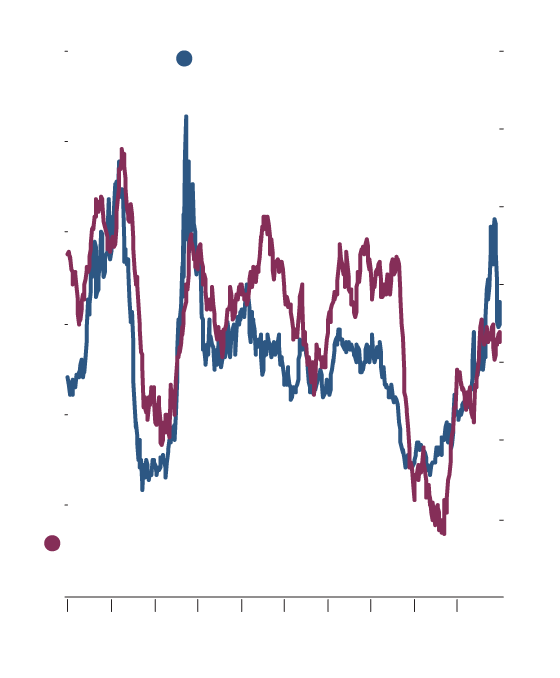
Energy stocks were among the primary beneficiaries of the reflation trade. Bullish futures trades hit record levels as hedge funds bet big on higher crude prices. As the first chart below highlights, however, the course of oil prices may be merely moving in the opposite direction of U.S. inventory levels. (Note that the crude inventories' year-over-year change is inverted to more clearly show the trend.) A stronger U.S. economy would start to drain storage levels and lead to higher crude prices, so I'm following this chart closely.
Expectations for accelerating economic growth and cyclical investments were primarily focused on the United States. Domestically focused U.S. small-cap stocks dramatically outperformed emerging-markets equities in the wake of the presidential election, but that trend has evaporated.
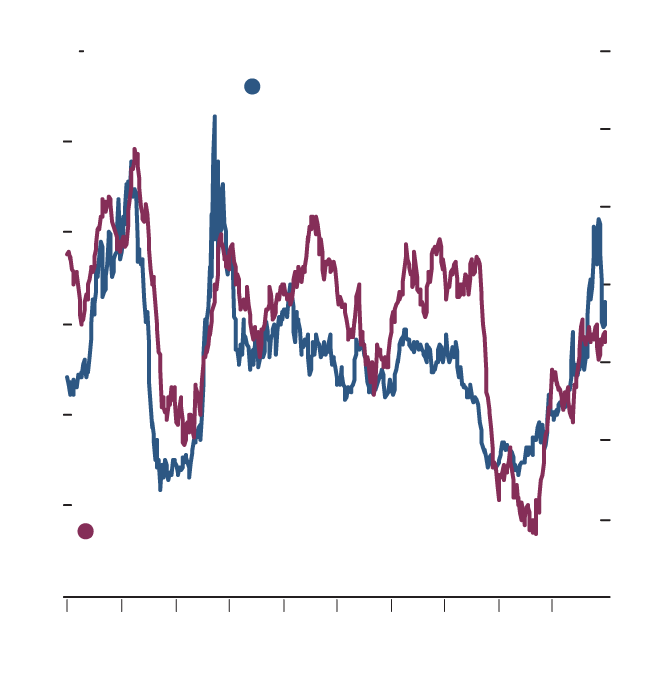
Gluskin Sheff chief economist David Rosenberg published a column in this space Thursday providing five big reasons to invest in emerging-markets stocks. The second chart shows that Canadians might have an easier, albeit more conservative, way to play emerging-markets strength – just buy more S&P/TSX stocks. The last decade has seen an extremely high correlation between emerging markets and domestic equities.
The chart is more relevant than ever in the current environment as a suggestion of the relative attractiveness of U.S. and developing-world investments, and for its implications for the direction for the domestic benchmark.
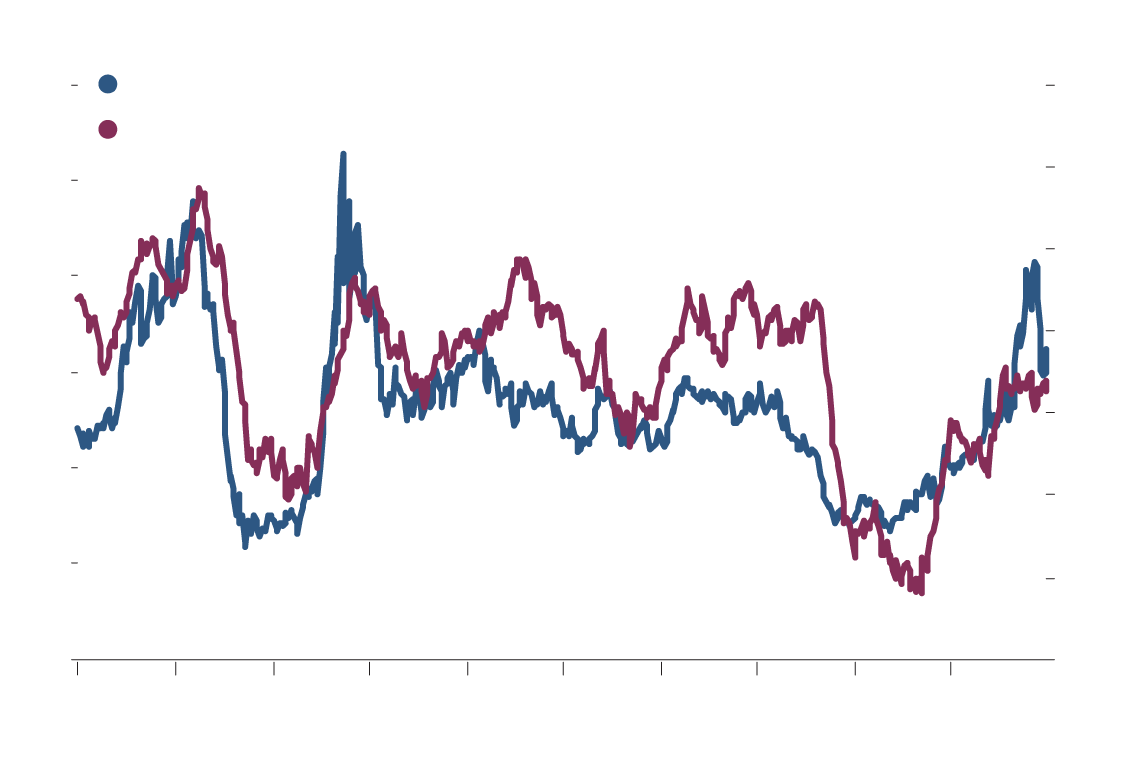
The third chart is the most important in my opinion. The blue line represents the yield on the 10-year U.S. Treasury bond. The purple line is the net futures position – bullish trades minus bearish trades – held by hedge funds on the price of the bond. A falling line indicates more short positions.
Longer term bond yields provide the most direct measure of future growth and inflation expectations. It's clear from the chart that beginning in July, 2016, economic optimism was climbing as the bond yield almost doubled from 1.4 per cent to 2.6 per cent. In November, futures bets on further increases in yields (by shorting the bond price – prices move in the opposite direction of yields) became an epidemic and the net position dropped like a rock.
Bond yields stopped rising in early 2017 on skepticism that growth would come in as strong as expected. Hedge fund managers raced to cover their short positions as the sharp rise in net futures positions from Feb. 24 shows. Now, things are more or less back to normal in bond futures with net bearish positions approaching bullish territory on the 10-year bond. This suggests that downward pressure on yields might be abating.
Yields have flat-lined but haven't declined significantly. The next trend will be extremely important for investors. A sustained rise in bond yields would signal a radically different investment environment where growth stocks outperform, and popular dividend-paying sectors lag. Falling yields would signal business as usual in the post-crisis period with sluggish economic growth, and strong performance from stable dividend payers.
Want to interact with other informed Canadians and Globe journalists? Join our exclusive Globe and Mail subscribers Facebook group.
 Scott Barlow