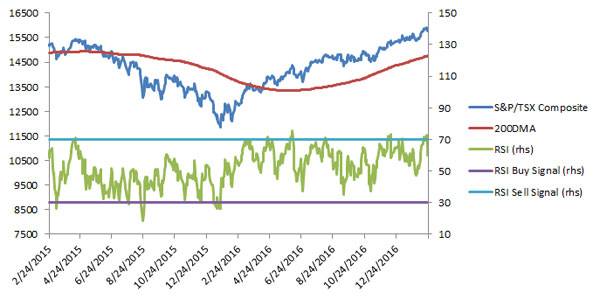
The S&P/TSX Composite dipped 0.5 per cent for the trading week ending with Thursday's close. According to Relative Strength Index (RSI), the benchmark is at the high end of neutral territory with a reading of 60 that is closer to the RSI sell signal of 70 than the oversold buy signal of 30.
There are still only two benchmark constituents trading in official oversold territory with RSI readings below 30 - Dominion Diamond Corp. and Boardwalk REIT. I did not choose either for this week's focus chart because Dominion Diamond is too volatile and Boardwalk is trading well below its 200-day moving average, which implies that RSI buy signals will be less effective in finding profitable entry points.
The benchmark has spent a lot of time near the overbought, RSI sell signal in the past twelve months. Sell signals occurred in April, early June and August, and December 2016. These signals were useful, the TSX fell afterwards, but thankfully not very far. More recently, an RSI signal on February 17 was followed by a minor 0.3-per-cent decline.
The last RSI buy signal was in January 2016, an indication of how strong the market's been since that time – no index decline has been serious enough to push it into oversold, technically attractive levels.
This isn't a very exciting chart if I'm being honest. The only real takeaway is that investors should wait a few days to buy the index, and the hottest sectors within it, when the RSI measure climbs above 70.
There are 34 stocks, 14 per cent of the S&P/TSX Composite, trading with RSIs above the 70 sell signal indicating they are overbought and vulnerable to a correction. Real estate services firm Colliers International Group Inc. is the most overbought stock in the index, followed by CIBC, FirstService Corp., and CCL Industries Inc.. Two forestry stocks, Interfor Corp. and West Fraser Timber Co Ltd. are among the ten most overbought benchmark constituents.
The usual caveat applies. Technical analysis is widely used by professional investors but, while helpful, should always be combined with fundamental research.
Follow Scott Barlow on Twitter @SBarlow_ROB.
| Oversold | RSI | Price | 200DMA | Return 1W % | Return YTD % | PE Ratio TTM | PE Ratio Fwd |
|---|
| DDC-T | DOMINION DIAMOND CORP | 25.68997 | 11.78 | 12.40025 | -13.06273 | -9.454269 | #N.A N.A | 9.617532783 |
|---|
| BEI.UN-T | BOARDWALK REAL ESTATE INVEST | 29.25889 | 43.96 | 50.58355 | -10.08386 | -9.283158 | 16.57206306 | #N.A N.A |
|---|
| | | | | | | | |
|---|
| | | | | | | | |
|---|
| | | | | | | | |
|---|
| Overbought | RSI | Price | 200DMA | Return 1W % | Return YTD % | PE Ratio TTM | PE Ratio Fwd |
|---|
| CIGI-T | COLLIERS INTERNATIONAL GROUP | 87.42251 | 63.22 | 50.93975 | 7.170706 | 27.74298 | 26.45125219 | 18.01225876 |
|---|
| CM-T | CAN IMPERIAL BK OF COMMERCE | 82.65053 | 119.4 | 104.2858 | 2.489272 | 8.981384 | 12.15582933 | 11.42911841 |
|---|
| FSV-T | FIRSTSERVICE CORP | 82.43773 | 73.8 | 61.3388 | -0.02708838 | 15.78287 | 61.5000465 | 30.56662171 |
|---|
| CCL. B-T | CCL INDUSTRIES INC - CL B | 82.24291 | 290.77 | 241.3221 | 8.318427 | 10.22365 | 27.61247204 | 22.85927673 |
|---|
| IFP-T | INTERFOR CORP | 80.8577 | 18.6 | 14.23735 | 2.705686 | 23.7525 | 20.87603048 | 15.23341523 |
|---|
| WCN-T | WASTE CONNECTIONS INC | 80.47316 | 114.15 | 99.37718 | 5.54785 | 8.3634 | 32.99256905 | 29.0306032 |
|---|
| AQN-T | ALGONQUIN POWER & UTILITIES | 80.0717 | 12.19 | 11.63115 | 3.043108 | 7.023698 | 28.57457538 | 21.84587814 |
|---|
| SW-T | SIERRA WIRELESS INC | 79.97528 | 34.9 | 21.7371 | 1.868077 | 66.03236 | 154.3476663 | 32.3615604 |
|---|
| REF.UN-T | CAN REAL ESTATE INVEST TRUST | 79.15678 | 50.25 | 47.32665 | 2.760733 | 8.883843 | 14.94787875 | #N.A N.A |
|---|
| WFT-T | WEST FRASER TIMBER CO LTD | 76.79884 | 54.83 | 44.1396 | 4.637405 | 14.20538 | 13.69315004 | 11.02332127 |
|---|
| NA-T | NATIONAL BANK OF CANADA | 76.55412 | 58.7 | 48.62685 | 0.41054 | 7.647171 | 13.61279704 | 11.55284393 |
|---|
| MIC-T | GENWORTH MI CANADA INC | 76.45229 | 38.01 | 33.23855 | 2.149958 | 14.24479 | 9.019000009 | 9.284318515 |
|---|
| EMP.A-T | EMPIRE CO LTD 'A' | 76.14047 | 17.77 | 19.2917 | 3.978937 | 13.7844 | 18.94870463 | 25.75362319 |
|---|
| CTC.A-T | CANADIAN TIRE CORP-CLASS A | 75.41376 | 156.28 | 138.8048 | 1.14556 | 12.72955 | 17.1555394 | 15.56108732 |
|---|
| MFI-T | MAPLE LEAF FOODS INC | 75.17738 | 31.5 | 29.0845 | 4.097818 | 12.01991 | 20.95472383 | 22.5 |
|---|
| BNS-T | BANK OF NOVA SCOTIA | 74.98895 | 81.68 | 70.565 | -0.3780919 | 9.256284 | 13.65404748 | 12.77447607 |
|---|
| OSB-T | NORBORD INC | 74.79982 | 39.51 | 31.65265 | 2.837065 | 16.5143 | 14.60706366 | 10.52399347 |
|---|
| TCN-T | TRICON CAPITAL GROUP INC | 74.5647 | 10.77 | 9.3323 | 2.182168 | 13.84778 | 18.60916487 | 14.79171341 |
|---|
| AAR.UN-T | PURE INDUSTRIAL REAL ESTATE | 74.47678 | 6.02 | 5.3982 | 2.207133 | 8.194097 | 16.31714895 | #N.A N.A |
|---|
| TD-T | TORONTO-DOMINION BANK | 74.43693 | 70.19 | 60.6381 | 1.328145 | 6.860757 | 14.83161656 | 13.6264803 |
|---|
| WPK-T | WINPAK LTD | 74.16527 | 51.57 | 46.17598 | 8.431451 | 13.54029 | 24.50356159 | 23.0706057 |
|---|
| UNS-T | UNI-SELECT INC | 74.12342 | 34.18 | 31.53218 | -0.2335027 | 15.9037 | 18.75362229 | 17.25907044 |
|---|
| EFN-T | ELEMENT FLEET MANAGEMENT COR | 73.33088 | 14.01 | 12.07373 | -0.4971569 | 12.43981 | 13.06727476 | 13.48411935 |
|---|
| DOL-T | DOLLARAMA INC | 73.12079 | 103.98 | 97.53935 | 1.861287 | 5.798284 | 29.86960369 | 26.32405063 |
|---|
| MBT-T | MANITOBA TELECOM SVCS INC | 72.2856 | 39.55 | 37.8195 | 0.3043341 | 4.18862 | 35.68190259 | 29.40520446 |
|---|
| ECN-T | ECN CAPITAL CORP | 72.1634 | 3.58 | #N.A N.A | 14.01273 | 8.484848 | #N.A N.A | 11.62337662 |
|---|
| BMO-T | BANK OF MONTREAL | 71.72634 | 101.7 | 88.29495 | 0.2167852 | 6.247559 | 13.8427328 | 13.1175029 |
|---|
| CAE-T | CAE INC | 71.63588 | 20.23 | 18.05805 | -0.9789562 | 7.720973 | 19.91494511 | 19.45192308 |
|---|
| CMG-T | COMPUTER MODELLING GROUP LTD | 71.46192 | 10.29 | 9.5841 | -0.2906951 | 12.9528 | 36.06615971 | 33.19354839 |
|---|
| KXS-T | KINAXIS INC | 71.21715 | 73.86 | 60.21395 | -0.9919543 | 18.176 | 141.2561211 | 64.87078063 |
|---|
| RY-T | ROYAL BANK OF CANADA | 71.12912 | 98.26 | 84.495 | -0.4256163 | 9.093622 | 14.24580761 | 13.63964464 |
|---|
| NVU.UN-T | NORTHVIEW APARTMENT REAL EST | 70.84381 | 21.86 | 20.79715 | 0.8302597 | 9.635763 | 10.13916566 | #N.A N.A |
|---|
| TIH-T | TOROMONT INDUSTRIES LTD | 70.22219 | 46.86 | 40.3324 | -1.139242 | 10.64936 | 26.53783261 | 22.07253886 |
|---|
| DRG.UN-T | DREAM GLOBAL REAL ESTATE INV | 70.17371 | 10 | 9.2099 | 2.564103 | 6.557311 | 14.79738678 | #N.A N.A |
|---|
|
|---|
Source: Bloomberg/Scott Barlow
