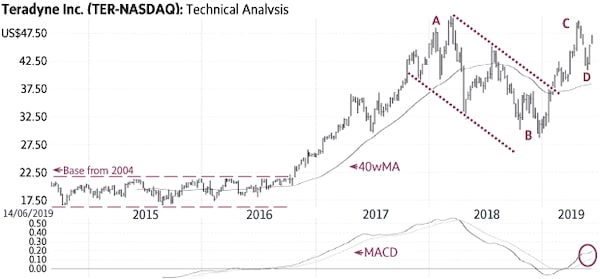
Teradyne Inc. (Friday’s close US$44.03) traded within a wide horizontal trading range mostly between US$9 and US$22 for about 13 years (dashed lines – partly shown). The stock started a new up-leg in 2016 when it broke above the top of this range and reached a high of US$50.68 in March, 2018 (A).
A corrective period followed during 2018 as the stock traded within a falling channel (dotted lines) and found support near ±US$30 (B). The recent rise above the top of this channel signalled the resumption of the up-trend (C).
Teradyne recently had a correction (D) and now appears ready to resume the up-trend. Only a sustained decline below US$38-39 would be negative.
Point & Figure measurements provide targets of US$49 and US$54. Significantly higher targets are visible.
rb-gi-meisels-0615?
Monica Rizk is the senior Technical Analyst and Ron Meisels is the president of Phases & Cycles Inc. (www.phases-cycles.com). And he tweets at @Ronsbriefs. They may hold shares in companies profiled.
Chart source: www.decisionplus.com
 Monica Rizk
 Ron Meisels