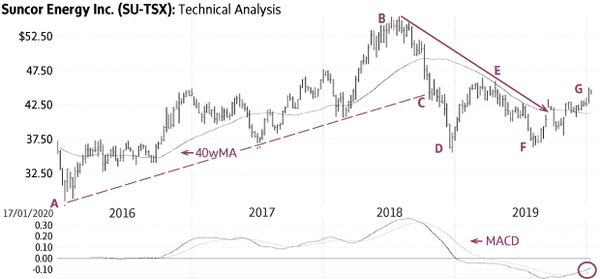
Suncor Energy Inc. (Friday’s close $43.90) stayed in an up-trend above a rising trend-line (dashed line) from early 2016 to mid-2018 (A-B). It fell below its 40-week Moving Average (40wMA) and the rising trend-line in mid-2018 (C) to signal the start of a new down-trend (solid line).
The stock found support near ±$36 in late 2018 (D), had a one-half recovery (E) and then pulled back to the previous low (F).
Recently, the stock rallied above its now flattened 40wMA and above the down-trend line (G). Furthermore, the current rise above $43-44 suggests the start of a new up-trend toward a Point & Figure target of $49.
Only a sustained decline below ±$41 would be negative.
stock
Monica Rizk is the senior Technical Analyst and Ron Meisels is the president of Phases & Cycles Inc. (www.phases-cycles.com). And he tweets at @Ronsbriefs. They may hold shares in companies profiled.
Chart source: www.decisionplus.com
 Monica Rizk
 Ron Meisels