Indigenous peoples
How Indigenous Canada is growing
The number of Canada's First Nations, Métis and Inuit continues to grow at a rate that far outstrips the rest of Canada, and the average age of people in those communities is significantly younger.
In 2016, Canada had 1,673,785 Indigenous people, according to the newly released data. They represented 4.9 per cent of the population – up from 3.8 per cent in 2006 and 2.8 per cent in 1996.
Some of this increase is natural growth caused by improved life expectancies and high fertility rates. But it is also due to more people self-identifying as Indigenous, Statistics Canada said. That is especially true in Atlantic Canada where the number of Indigenous people is relatively small but where the people who self-identify as First Nations more than doubled between 2006 and 2016.
The First Nations, Inuit and Métis have all seen their numbers climb. But the Métis, who the courts recently declared to be "Indians" under the Constitution and therefore owed a fiduciary duty by the federal government, had the largest increase. Their population grew by more than 50 per cent between 2006 and 2016.
Most Métis live in Ontario and the western provinces and, for the first time, in 2016, there were more Métis in Ontario than in the rest of Canada.
Among First Nations people with registered or treaty status, there was a population growth over the past decade of 12.8 per cent. But the real growth was off reserve where the numbers climbed by 49.1 per cent.
The average age of the Indigenous population in 2016 was 32.1, which was up slightly from 2011 but still almost a decade younger than the non-Indigenous population. Despite being lower than the non-Aboriginal population, the average age has risen since 2011, when it was calculated to be 30.7. And while the 2016 census found for the first time that Canadian seniors outnumbered children, that trend was not true for the Indigenous population.
Among Inuit, for instance, 33 per cent were under the age of 14 while just 4.7 per cent were over 65.
But the number of First Nations, Métis and Inuit who are over the age of 65 per cent is also increasing. In 2006, they represented 4.8 per cent of the Indigenous population. That climbed to 7.3 per cent in 2016 and Statistics Canada projects that could more than double by 2036.
This year's data represents one of the fullest pictures of Canada's indigenous population. Statistics Canada reports that only 14 reserves or settlements were incompletely enumerated, the lowest number since 1986.
More Indigenous children in care
Indigenous preschoolers account for more than half of all Canadian children aged four and under who are in foster care, a number that has put renewed pressure on Ottawa to keep its promise to fund the social services that would allow them to stay in their homes.
Data released on Wednesday from last year's census show that the number of First Nations, Métis and Inuit continues to climb at a rate that far outstrips the rest of Canada, and that the average age of people in those communities is significantly younger. Almost a third of the Indigenous population is under the age of 15.
The statistics also show that large numbers of Indigenous children start their lives in troubled circumstances.
Less than eight per cent of all Canadian kids aged four and under are First Nations, Métis or Inuit, but Indigenous children accounted for 51.2 per cent of preschoolers in foster care in 2016. That was up more than two percentage points from 2011.
First Nations children alone accounted for 41.4 per cent of all children in care.
Advocates for Indigenous children have been saying for years that not enough services are provided to Indigenous communities to allow children from families with social problems to stay in their homes.
The Canadian Human Rights Tribunal found in 2016 that the federal government discriminates against First Nations children on reserves by failing to provide the same level of child welfare services that exist elsewhere in Canada. It ordered Ottawa to correct the situation and the Liberal government said it would do so.
But child welfare advocates say, despite the federal promises, the inequity has yet to be adequately addressed.
"The first 2,000 days of life are absolutely critical for setting down the building blocks developmentally for a successful life over time," Cindy Blackstock, the executive director of the First Nations Child and Family Caring Society, who launched the human rights case, said on Wednesday after the census findings were released.
"This over-representation [of Indigenous children in the child welfare system] is symptomatic of the structural discrimination that these First Nations children and their families have experienced since Confederation," Dr. Blackstock said. "And it also reinforces the vital importance of Canada's immediate compliance with the Canadian Human Rights Tribunal order to stop the discriminatory provision of child and family services."
The government's own documents show that, if sufficient money and adequate services were provided, many of the Indigenous children in foster care could remain with their families, Dr. Blackstock said. Despite that, she added, the Human Rights Tribunal is preparing to issue a fifth non-compliance order against the government for failing to meet its demand that child and family services be adequately funded.
Jane Philpott, the Minister of Indigenous Services, said reducing the number of Indigenous children in care is a priority for her new department, and she plans to bring together Indigenous leaders, social services agencies, and provinces and territories to discuss the issue.
"This is a huge concern," Dr. Philpott said. "When children are not with their families or in their own culture and communities, that can have very long-standing adverse consequences."
The census data also shows that Indigenous children are less likely to live in two-parent homes than other Canadian children. While 80 per cent of all Canadian kids live with two parents, only 54.5 per cent of indigenous children live in similar circumstances. And they are more likely to be living with their grandparents, both for cultural reasons and also because of the financial benefits of shared accommodation and the lack of sufficient housing.
Many Indigenous people are living in sub-standard housing
Many First Nations and Inuit people in Canada live in homes that require major repairs or are too small to meet the needs of their families.
It is a problem exacerbated by the remote nature of the communities and the harsh environment of Canada's North, as well as the poverty that pervades Indigenous life in this country.
The proportion of First Nations, Métis and Inuit who said in 2016 that their homes were in need of major repairs actually dropped a little from five years earlier. But there were large differences in what was reported by those living on reserves and the experience of those living in towns and cities.
The census also found that a fifth of Canada's aboriginal population believed their homes required major work in 2016. That compares to just 6 per cent of the general population.
Dr. Philpott pointed out that her government promised significant investments in housing for Indigenous people in the most recent federal budget.
The latest estimates suggest that 40,000 new homes are required and another 40,000 need repair, the minister said. But, she added, "we are making a dent in the serious gaps in housing and we are looking at ways to, not only continue these investments, but to find other creative solutions to be able to more rapidly address those gaps."
The problem is particularly acute for First Nations and Inuit people.
Among status Indians living on reserves, 44.2 per cent said their homes said their homes needed significant repairs while 31.5 per cent of Inuit in the North said the same of their accommodation.
That contrasts with the experience of First Nations people living off reserve – just 14.2 per cent said their homes needed major repairs.
On reserves and in the North, the houses are not just in a bad physical state, they are also too small. More than a third of First Nations people living on reserve and more than 40 per cent of Inuit said they lived in overcrowded housing.
According to the 2016 census data, more than one in 10 Indigenous people lived in homes that needed another bedroom to comfortably sleep all of the occupants. And nearly three per cent lived in homes that had a shortfall of three bedrooms or more.
More young Indigenous people are learning to speak the languages of their ancestors
Day-to-day conversations in the Indigenous languages of Canada are becoming rare as the seniors who grew up speaking them pass away, but more young people are taking classes to learn the tongues of their ancestors, which Statistics Canada calls the "mother tongue."
It is a phenomenon, revealed in 2016 census data, that is promoted by Indigenous leaders and supported financially by the federal Liberal government. And it may preserve languages that were, not long ago, under threat of becoming extinct.
More than 260,000 Canadians reported last year that they were able to speak one of the roughly 70 Indigenous languages that are still in use across the country.
More than half of those people spoke one of the Algonquian languages, which include Cree, Ojibway and Oji-Cree. The second largest language group was that of the Inuit with 42,065 speakers. And the numbers dropped off significantly after that with some languages being spoken by less than 1,000 people. Kutenai, for instance, is spoken by 170.
The percentage of Indigenous people who reported being able to conduct a conversation in an Indigenous language dropped significantly from 21.4 per cent in 2006 to 15.6 per cent in 2016. But the number of people who said they could speak an indigenous language increased by 3.1 per cent over the same decade.
Statistics Canada says this is evidence that people are learning Indigenous languages as a second language, even though they grew up speaking English or French at home.

IMMIGRATION
How a diverse Canada is growing through immigration

Filipino population group growth
by Census Metropolitan Area
Per cent, 2006 vs. 2016
0 - 125%
125 - 250
250 - 375
375 - 500
500+
Kelowna
358%
St. John's
418%
Regina
626%
Moncton
405%
Lethbridge
460%
Saskatoon
532%
Halifax
445%

Filipino population group growth
by Census Metropolitan Area
Per cent, 2006 vs. 2016
0 - 125%
125 - 250
250 - 375
375 - 500
500+
Kelowna
358%
St. John's
418%
Regina
626%
Moncton
405%
Lethbridge
460%
Saskatoon
532%
Halifax
445%

Filipino population group growth by Census Metropolitan Area
Per cent, 2006 vs. 2016
0 - 125%
125 - 250
250 - 375
375 - 500
500+
Kelowna
358%
St. John's
418%
Regina
626%
Moncton
405%
Lethbridge
460%
Saskatoon
532%
Halifax
445%

Arab population group growth
by Census Metropolitan Area
Per cent, 2006 vs. 2016
0 - 125%
125 - 250
250 - 375
375 - 500
500+
Kelowna
362%
St. John's
489%
Greater
Sudbury
430%
Lethbridge
757%
Thunder Bay
590%
Moncton
555%

Arab population group growth
by Census Metropolitan Area
Per cent, 2006 vs. 2016
0 - 125%
125 - 250
250 - 375
375 - 500
500+
Kelowna
362%
St. John's
489%
Greater
Sudbury
430%
Lethbridge
757%
Thunder Bay
590%
Moncton
555%

Arab population group growth by Census Metropolitan Area
Per cent, 2006 vs. 2016
0 - 125%
125 - 250
250 - 375
375 - 500
500+
Kelowna
362%
St. John's
489%
Greater
Sudbury
430%
Lethbridge
757%
Thunder Bay
590%
Moncton
555%
The population of racialized residents has steadily increased, now representing 22.3 per cent of Canada's population. Statistics Canada collects data on population groups – a separate category from ethnicity – meant to quantify the number of people who self-identify as white, Aboriginal or as members of a range of visible minority groups. The largest group is South Asians (1,924,635)
Filipinos are the fastest-growing racialized group in the country (780,125) but right behind them are Arabs, whose population nearly doubled in the past decade to 523,235. A large portion of them have arrived in Canada as refugees.
The most energetic growth of the Arab population in the last decade was seen in Lethbridge, Alta., and Thunder Bay, Ont., which saw increases of 757 per cent and 590 per cent respectively. For Filipinos, it was in Regina (626 per cent) and Lethbridge (460 per cent).
When Ed Reserva first arrived in Canada from Manila, he found a job as an accountant in Calgary. But after 12 years in the city, the cost of living there became too much, and that, coupled with the oil-related economic downturn, prompted him to relocate to Lethbridge.
In the decade since he and his family of five moved there, the unassuming prairie city of 87,572 has become a popular landing spot for immigrants. The Filipino population in particular has increased by 460 per cent in that period, and the Arab population by 757 per cent.
Although immigration from Asia has transformed the face of many cities across Canada, it still has not displaced the country's population who trace their routes to Western Europe. Those who self-identified as English (6.3 million), Scottish (4.8 million), French (4.7 million) and Irish (4.6 million) rounded out the top of the list of ethnic origins reported in 2016.
While Canadian was the most commonly listed ethnic origin on the census, the notion of a national identity is growing weaker. In 2001, 39.5 per cent of the population listed their ethnicity as simply Canadian, but in 2016, it decreased to 32.3 per cent.
The figure may have been high in 2001 due to "a successful ad campaign funded by a federal government or provincial government or a beer company," says Michael Haan, the Canada Research Chair in Immigration and Ethnic Relations at University of Western Ontario, who adds that it may have declined since then due to more people claiming new identities, such as aboriginal ones.
What it means to self-identify as Canadian is up to each individual. He points out that in 2001 and 2006, immigrants were the most likely group to claim their ethnicity as Canadian.
"Maybe it was just because they'd just gone through an immigration process and had gone through all the citizenship classes," he says. "They probably had a better sense of what it means to be Canadian than many Canadian-born people did."
The longer you're in Canada, the more likely you are to list multiple ethnic origins, the result of marriages and common-law relationships between people of different ethnicities, but also increasing knowledge of family history. Those who are more likely to report just a single ethnic origin – suggesting fewer mixed relationships – are groups with shorter histories in Canada, such as people of Asian and African origin.

Where new Canadians are coming from
For the first time, Statistics Canada has revealed the breakdown by the three types of immigrants who are admitted to Canada as permanent residents. The vast majority of immigrants, six in 10, arrive under the economic category – mostly through either the skilled workers program or the provincial and territorial nominees program. Another three in 10 arrive to reunite with family members who are already in Canada. The remaining one in 10 are refugees. But due to the conflict in Syria, one in four immigrants who arrived in Canada in the first five months of 2016 was a refugee.
A total of 26,550 Syrian refugees settled in Canada from 2011 to 2016. The other top countries of birth for refugees who settled in this period were Iraq (15,505), Afghanistan (6,105), Eritrea (5,125) and the Democratic Republic of the Congo (5,020). This is in keeping with previous waves of refugees, whose countries of birth reflected the political instability of the time: from 2001 to 2010, Colombia topped the list; from 1991 to 2000, it was Sri Lanka; from 1980 to 1990, it was Vietnam.
Between 2011 and 2016, the majority of the approximately 1.2 million new immigrants who arrived in Canada, totalling 61.8 per cent, were born in Asia, with the most coming from the Philippines (188,805). Seven of the top 10 countries of birth for Canadian newcomers in 2016 are in Asia: the Philippines, India, China, Iran, Pakistan, Syria and South Korea.
Immigrants who arrived in Canada between 2011 and 2016 make up 16.1 per cent of the total foreign-born population in the country. A total of 25.7 per cent of foreign-born residents in Canada arrived before 1981 and the next largest group, accounting for 19.7 per cent, arrived between 1991 and 2000.
Immigrant children (those who were born outside Canada or have at least one foreign-born parent) are expected to make up 47.2 per cent of the population of residents under 15 by 2036, according to Statistics Canada projections. In 2016, they made up 37.5 per cent of the under-15 population. The population of those under 15 with two foreign-born parents is expected to increase at a steady rate as well, hitting 26 per cent by 2036.

Where new Canadians are going: Decline in Ontario, growth in Alberta
Whether they are Filipino women looking for work as caregivers in Regina, or Syrian families trading a chaotic life in a refugee camp for a calmer one in Lethbridge, Alta., a larger portion of Canada's immigrants are skipping over traditional newcomer centres like Toronto and Vancouver and settling in the prairie provinces.
While the largest portion of newcomers to Canada are still moving to Ontario (39 per cent), the country's most populous province is taking a markedly smaller share of immigrants than it did in 2001 (55.9 per cent).
In the past 15 years, immigration to the prairies has doubled with Alberta as the strongest magnet. In 2016, 17.1 per cent of all immigrants to Canada settled in the province, up from 6.9 in 2001. Lethbridge now has 15,365 immigrants, which represents 13.5 per cent of the city's population.
"Due to economic factors, immigrants are looking for jobs," explains René Houle, a senior analyst at Statistics Canada. "We know in Alberta, in Saskatchewan, the economy is growing, it's strong."
Through the government's provincial and territorial nominee program, immigrants were directed to particular regions of Canada outside of the typical immigrant centres. About seven in 10 immigrants in Manitoba, Saskatchewan and Yukon were provincial or territorial nominees. In Regina, the Filipino population grew by 626 per cent from 2006 to 2016 – an even larger margin than in Lethbridge.
As part of his duties with the Southern Alberta Ethnic Association, Mr. Reserva assists other Filipinos who arrive with hopes of establishing a new life in Canada. Many work on farms in the Lethbridge area, while others are employed in the food industry and as caregivers.
"It is a very comfortable fit," Mr. Reserva said of what Lethbridge offers newcomers, such as an annual summer food festival and the Filipino-Canadian Basketball League.
Linda Helwig was a nurse in her hometown of Jaro in the Philippines before she immigrated to Montreal. She eventually headed west to be with her son and his family. The first-year president of the Filipino-Canadian Association of Lethbridge says Filipinos have transformed her city.
"Without Filipinos here, the restaurant and food industry would not exist," she said. "You go to Tim Hortons and it is all Filipinos there. … They work on farms and dairies. They do evening and night shifts. They work hard." f
How new Canadians are living: Multigenerational housing
Statistics Canada says the family environment "is the main vehicle for transmitting the culture of origin to children" and that the more relatives there are under one roof, the better the transmission. Second-generation immigrant children under 15 (those who were born in Canada but with two foreign-born parents) might then be the ones receiving the strongest cultural signals from family, as they were the most likely to be living in multigenerational households. A total of 18.2 per cent reported such a living arrangement, whereas those children who had only one foreign-born parent had half that rate: 9.5 per cent. Only 6.4 per cent of foreign-born children (first generation immigrants) had such a living arrangement, a figure similar to that of children with Canadian-born parents.
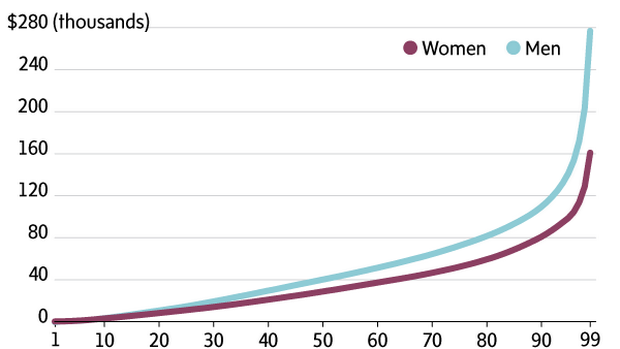
Income
How much income goes to Canada's highest earners
Canada's highest earners continued to capture the largest share of the country's total income. The top 1 per cent of earners took home 11.2 per cent of Canada's total combined income in 2015 compared with 11.1 per cent in 2005, according to new census data from Statistics Canada. The top 5 per cent of earners pulled in nearly a one-quarter of the income pie versus 24.3 per cent a decade ago. The top 20 per cent of all earners had just over half of Canada's total combined income for the same time period.
CENSUS 2016: WHAT WE'VE LEARNED SO FAR