
For many students gearing up to graduate from high school, a difficult task lies ahead – picking a university. Whether students want a school with a robust athletics department, innovative research or experiential learning programs, Canadian universities have a lot to offer. Students just need to know where to look.
This year, we connected with Canadian schools to find out which program offerings are out there and whether universities are adapting to Canadian trends.
We have compiled profiles detailing some of the most popular and unique postsecondary options in Canada, ranging from specialized programs to Indigenization of curricula and campus spaces to enhanced support for studentrun startups.
In order to measure these universities against each other, we gathered data that demonstrates affordability, degree completion, student satisfaction, research funding, class size, innovation and other factors. As in past years, we relied on the National Survey of Student Engagement (NSSE), which allows students to rate their university experience in detail, so we can gain a clearer picture of how they view their academic institutions.
In this report, parents and students looking to explore the Canadian university landscape will find profiles of public, secular, degree-granting schools for English-speaking students, as well as snapshots of faith-based universities and francophone schools.
Methodology
Compiling data from publicly available sources on financial, demographic and other aspects, we compared universities to their regional counterparts. Canada's five regions are covered in this report – British Columbia, the Prairie provinces, Ontario, Quebec and the Atlantic provinces. We detail how universities rank in their respective regions based on cost, financial aid, research, applied learning, library spending and overall student experience.
Tuition
We sought out the most upto-date annual postsecondary costs that full-time undergraduate students should expect to pay, including tuition and compulsory fees (such as medical and dental insurance, transit passes and student union fees).
The legends and icons illustrate whether a university's tuition is at least $300 above average ($$), average ($) or at least $300 below the provincial or regional average ($).
Provincial averages were used for Quebec, B.C. and Ontario. Regional averages were used for Prairie and Atlantic provinces. For B.C., the median tuition rate was used instead of the average as a point of comparison to account for Quest University's high tuition.
Financial Aid
Universities allot a certain percentage of their overall budgets in the form of scholarships and bursaries. We determined which schools devote aboveaverage (green), average (yellow) and below-average (red) proportions of their overall budgets to financial aid. (Universities in the Atlantic and Prairie provinces, Quebec and Ontario rated at least 20 per cent above or below the regional average; those in British Columbia were at least 50 per cent above or below the provincial average.)
Research
Many schools in the country benefit from funds from the three major national research funding councils. The 10 universities receiving the largest amounts of research funding from SSHRC, NSERC and CIHR are indicated in green; those universities awarded with $20-million or more are shown in yellow.
Applied
Universities that specialize in applied or vocational training receive special recognition.
Library
We rate universities based on their per-student spending on library resources. Yellow icons indicate average spending; red icons, below-average spending; and green icons, above-average spending (at least 50 per cent, except for Quebec schools, for which at least 20 per cent is used).
Student Experience
Using the most recent available NSSE responses from senior students who rated their overall university experience, we determined whether schools offer above-average (green), average (yellow) or below average (red) educational experiences. (Some schools did not participate or reveal their scores.)
Considerably below average is defined as 0.2 points below the NSSE average. Most of the NSSE results are from 2014, but there are exceptions: Acadia and UBC: 2013; Cape Breton, Kwantlen, Queen's, Quest, Royal Roads, University of Northern British Columbia and the University of the Fraser Valley: 2016; University of New Brunswick: 2015.

Find out more about British Columbia universities here.

Find out more about Alberta universities here.

Find out more about Manitoba and Saskatchewan universities here.

Find out more about Ontario universities here.

Find out more about Quebec’s English-instruction universities here.

Find out more about Atlantic Canada universities here.
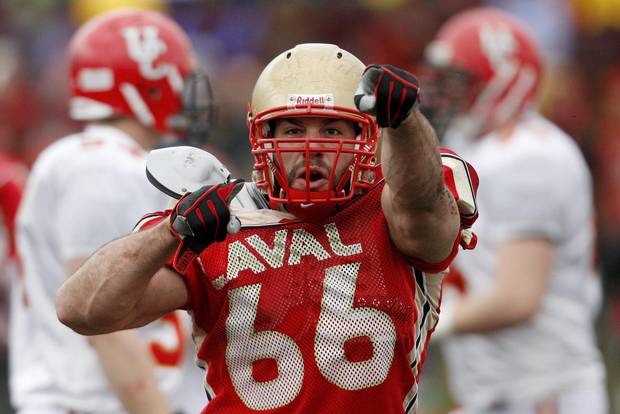
Laval University Rouge et Or Etienne Legare celebrates his sack against Univeristy of Calgary Dinos’ quarterback Deke Junior during the second quarter of the Uteck Bowl college football game at Laval University in Quebec City.
Mathieu Belanger/Reuters
Find out more about french-instruction universities here.
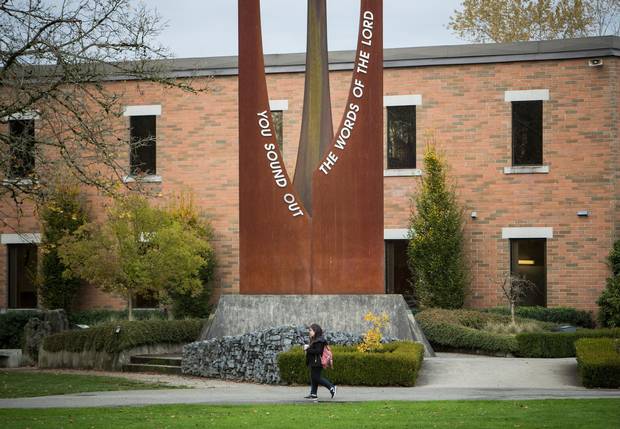
Students are pictured on campus at Trinity Western University in Langley, B.C.
Ben Nelms/The Globe and Mail
Find out more about faith-based universities here: