
Editor's Note: This story was originally published in January of 2017.
Electricity prices in Ontario have soared in the past decade. Since 2006, the top rate for power has risen four times as fast as inflation.
The problem has aggravated voters, piled on costs for business – particularly factories and other industrial enterprises – and remained one of the most persistent hot buttons for the province's politicians.
Facing record-low approval ratings, Premier Kathleen Wynne last September announced an 8-per-cent subsidy for residential and small-business bills, which took effect Jan. 1.
How did we get here? How high are electricity prices exactly? How does Ontario compare with other jurisdictions? And what can we do to drive rates down?
The short answer is that a series of policy decisions – most significantly, upgrading infrastructure and signing fixed 20-year deals with private companies to produce electricity – have increased prices over the past decade.
It hasn't helped the government that a series of controversial decisions, such as cancelling two gas-fired power plants for political reasons and privatizing Hydro One, have intersected with electricity policy and attracted blame for the high prices. While the cancellation of the plants has driven up rates, it's a relatively small part of the overall increase; the Hydro One privatization, meanwhile, has not yet had an effect.
How much do Ontarians pay for power?
Ontario's electricity prices are far higher than those in the rest of the country. Quebec, for example, enjoys rates less than half of those in Ontario. The international picture is more complicated. Ontario rates are generally significantly lower than those across the border in New York and about half what Germans, Danes or Italians pay.
The bad news, for consumers and the government, is that rates likely will not be coming down any time soon.
Use our calculator to find out how much you’d pay for your monthly electricity bill in cities across Canada and the U.S.
I live in a
in
that is roughly square feet
How you shape up
If you live in a in with an area of square feet, we estimate you’ll consume approximately kilowatt hours of electricity each month. Based on those figures, here’s how much you’d pay per month in each of the following cities, based on rates on April 1, 2016:
Note: This calculator tries its best to approximate an electricity bill based on home size and kilowatt hour consumption, but electricity prices vary widely across regions and households. Consumption below 625 kWh assumes a constant cost per kWh. All prices before taxes and in Canadian dollars.
The Globe and Mail, Source: Natural Resources Canada and Hydro-Québec
How high are electricity prices exactly?
In November, 2006, when the Ontario Energy Board set the first new rates after a four-year freeze, off-peak electricity cost 3.5 cents a kilowatt hour, mid-peak power cost 7.5 cents a kilowatt hour and on-peak, when juice is most in demand, was 10.5 cents a kilowatt hour. The current rates, set in November, 2016, are 8.7 cents, 13.2 cents and 18 cents.
That means the price of off-peak power has rocketed up 149 per cent over a decade, mid-peak power has shot up 76 per cent and on-peak is up 71 per cent. By way of comparison, inflation in Ontario over the same period was about 18 per cent.
Where does Ontario's power come from?
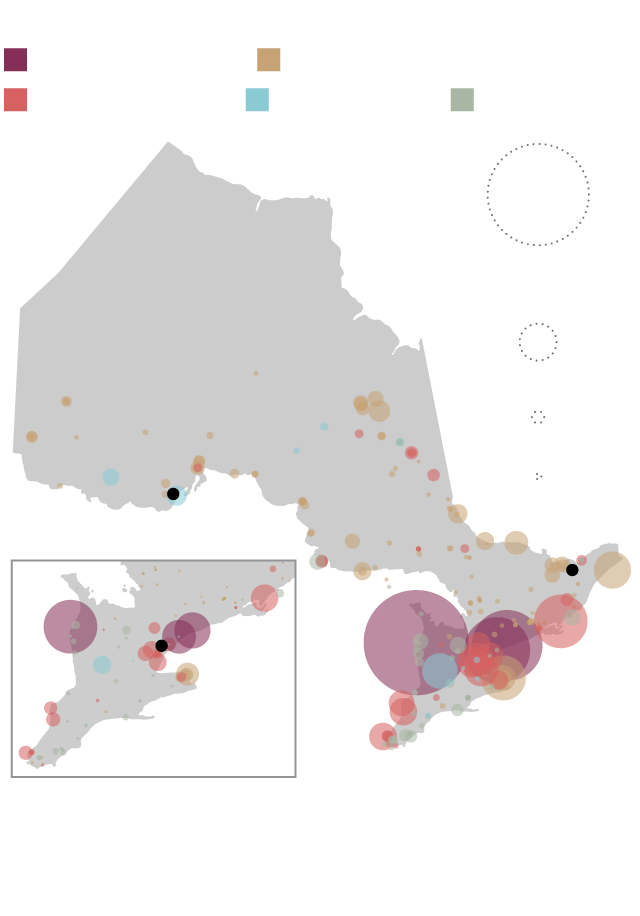
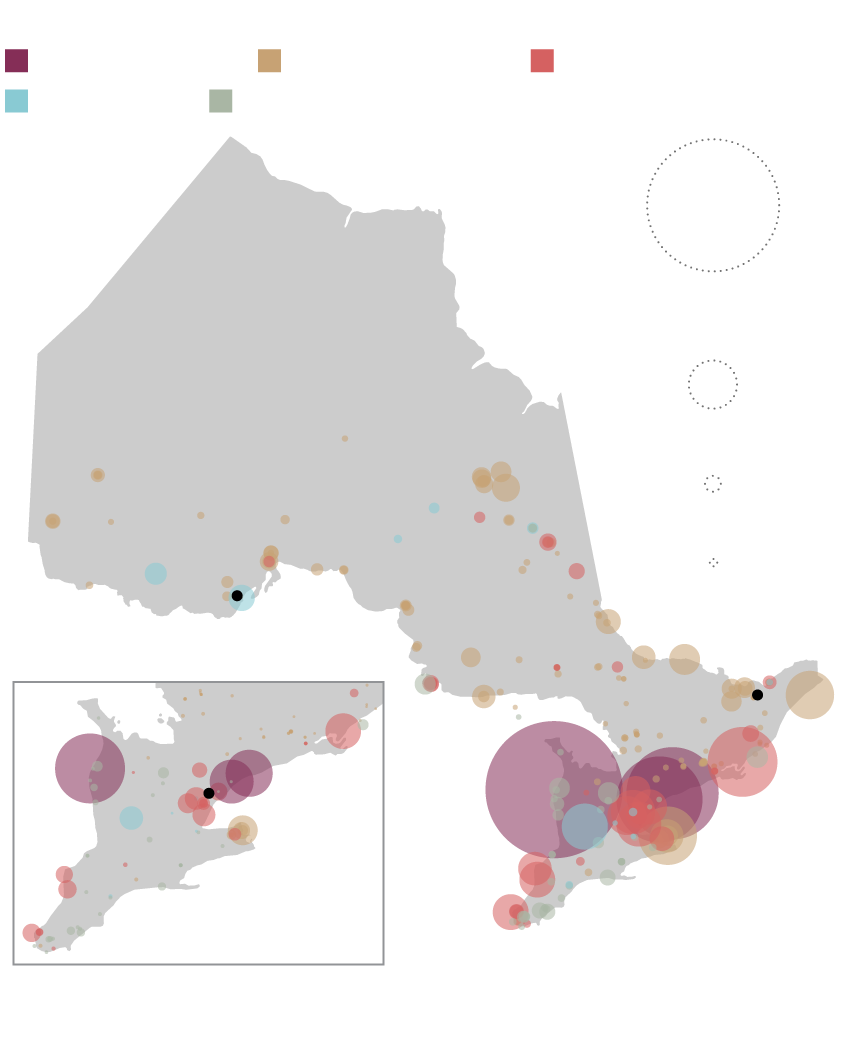
Ontario’s power generation infrastructure
Nuclear (3 plants)
Hydroelectric (133)
Biomass (11)
Wind (36)
Natural gas (33)
7,000 MW
capacity
1,000
100
Thunder Bay
10
Ottawa
Toronto
Southwestern Ontario detail
Note: Data last updated by the Canadian Electricity Association on Jan. 3, 2013.Capacity scale applies only to main map.

Ontario’s power generation infrastructure
Nuclear (3 plants)
Hydroelectric (133)
Natural gas (33)
Biomass (11)
Wind (36)
7,000 MW
capacity
1,000
100
10
Thunder Bay
Ottawa
Toronto
Southwestern Ontario detail
Note: Data last updated by the Canadian Electricity Association on Jan. 3, 2013. Capacity scale applies only to main map.
Ontario’s power generation infrastructure
Hydroelectric (133)
Natural gas (33)
Nuclear (3 plants)
Biomass (11)
Wind (36)
7,000 MW
capacity
1,000
100
Thunder Bay
10
Southwestern Ontario detail
Ottawa
Toronto
Note: Data last updated by the Canadian Electricity Association on Jan. 3, 2013. Capacity scale applies only to main map.

Ontario’s power generation infrastructure
Nuclear (3 plants)
Hydroelectric (133)
Natural gas (33)
Biomass (11)
Toronto
Wind (36)
Southwestern Ontario detail
Thunder Bay
Ottawa
10
100
1,000
7,000 MW
capacity
Note: Data last updated by the Canadian Electricity Association on Jan. 3, 2013. Capacity scale applies only to main map.
Despite the colloquial use of the term "hydro" as a synonym for electricity in Ontario, the province actually uses a mix of sources – not just hydroelectric dams – to get its power.
By far, the largest source of electricity in Ontario is nuclear, accounting for about 60 per cent of the electricity produced in 2015. The province has three nuclear plants: the government-run Darlington and Pickering nuclear generating stations, east of Toronto, and the Bruce Nuclear Generating Station, on Lake Huron, which is run by the private company Bruce Power.
The second-largest source is hydroelectricity, which accounted for 24 per cent of generation in 2015, followed by natural-gas plants (10 per cent) and wind power (6 per cent). Biofuel (which essentially means burning wood pellets) and solar power each provided less than 1 per cent of the province's power supply.
Generally speaking, the power supply can be divided between "baseload" and "peaking" power. The baseload generation is typically running all the time to provide a steady supply that the province always needs. Peaking power is only switched on when needed.
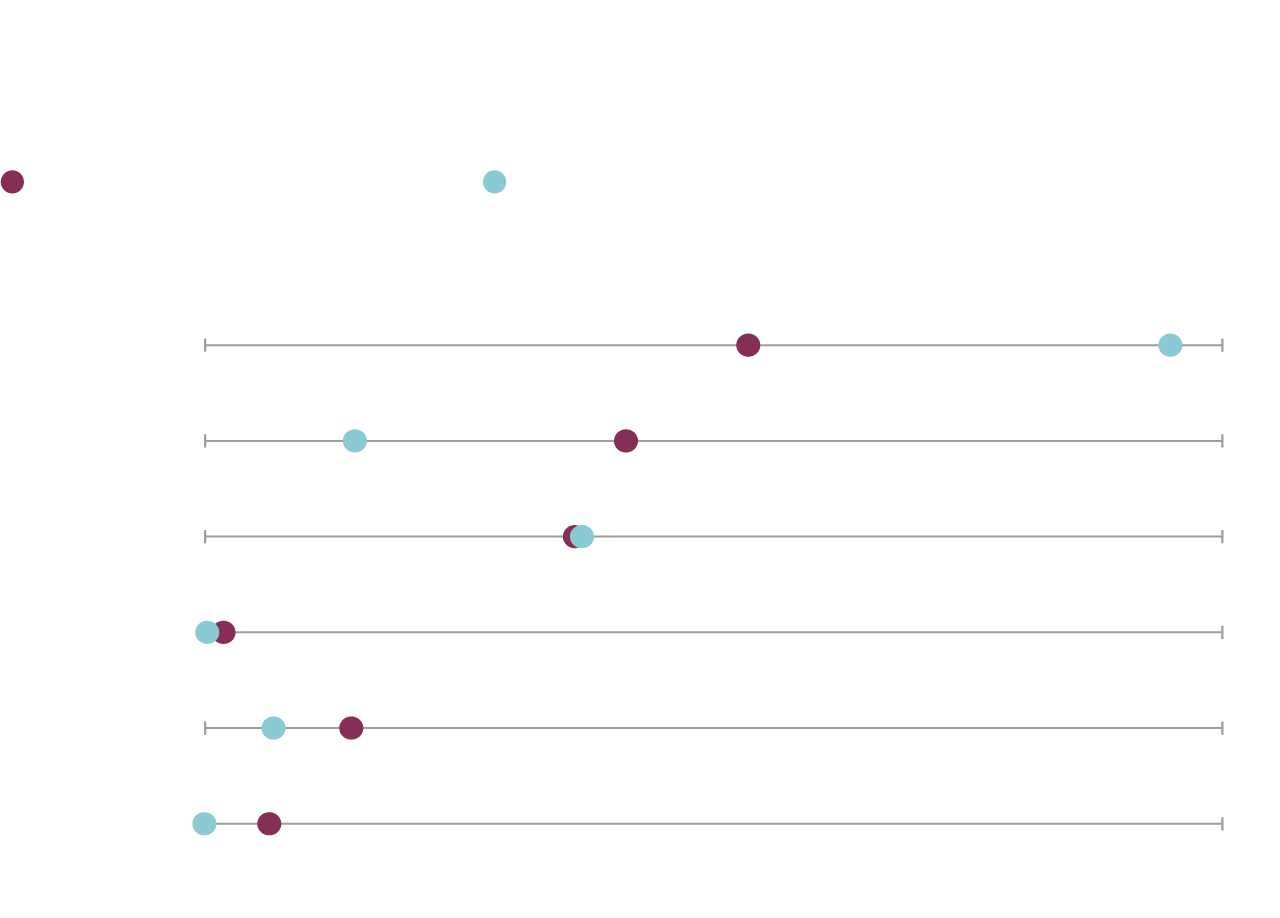
This difference is what accounts for the gap between installed capacity and actual production. For example, nuclear power (which is part of the baseload) accounts for just 36 per cent of the province's installed capacity (i.e., the province's total generating power) but actually produces 60 per cent of the supply. Natural gas, which is mostly used for peaking, accounts for 28 per cent of installed capacity but produces just 10 per cent of the supply.
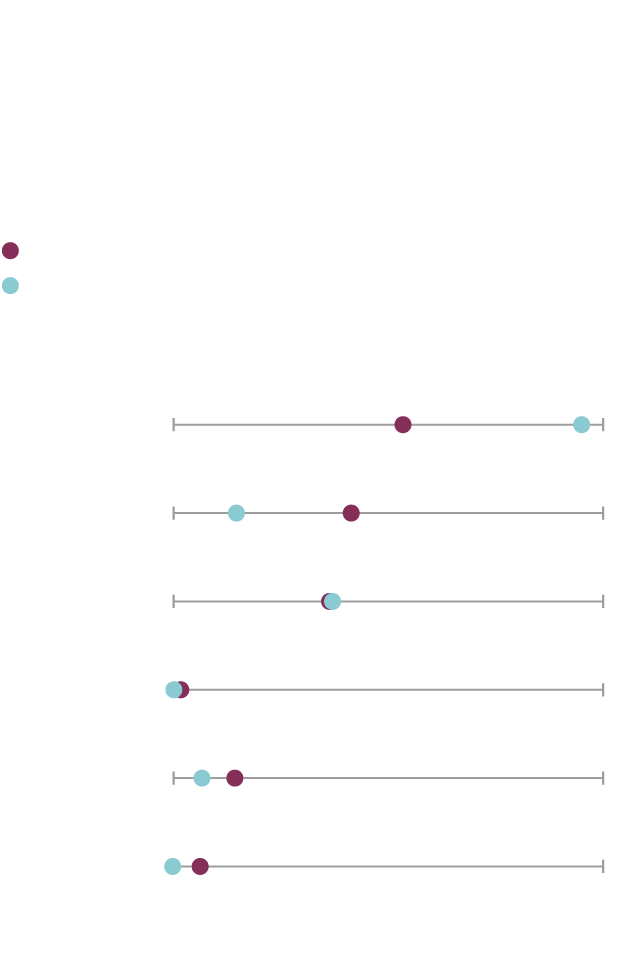
Ontario’s 2014 installed energy capacity vs. actual annual supply, by source
While a third of Ontario’s capacity is nuclear, almost 60 per cent of the electricity Ontarians consume comes from nuclear power plants, meaning nuclear plants are running non-stop while some other power sources (particularly gas plants) often go unused.
Per cent of total installed capacity
Per cent of total energy supply
34.7 per cent of
total installed
capacity
61.6 per cent of
annual energy
supply
Nuclear
0
65%
9.6%
26.9%
Gas
23.6%
24.1%
Hydroelectric
0.2%
1.2%
Bioenergy
4.4%
9.4%
Wind
0.01%
4.2%
Solar
Note: Numbers may not add up to 100% due to rounding.
How is the system organized? Who sets the rates?

Cost components of Ontario’s electricity system, 2014
$19-billion
Generation
$11.8-billion
62.1% of total
Distribution
(e.g. the local utility)
$3.4-billion
17.9%
Transmission
(e.g. Hydro One, for the most part)
$1.6-billion
8.4%
Debt retirement
(goes towards paying down the leftover debt from Ontario Hydro)
$1.0-billion
5.3%
Regulatory
(miscellaneous expenses, such as keeping the IESO
operating)
$900-million
4.7%
Conservation programs
$300-million
1.6%

Cost components of Ontario’s electricity system, 2014
$19-billion
Generation
$11.8-billion
62.1% of total
Distribution
(e.g. the local utility)
$3.4-billion
17.9%
Transmission
(e.g. Hydro One, for the most part)
$1.6-billion
8.4%
Debt retirement
(goes towards paying down the leftover debt from Ontario Hydro)
$1.0-billion
5.3%
Regulatory
(miscellaneous expenses, such as keeping the IESO operating)
$900-million
4.7%
Conservation programs
$300-million
1.6%
Ontario's electricity system is a tangle of public, private and semi-private companies. Roughly speaking, you can break it into three major components: generation (producing the power), transmission (getting the power across the province through high-voltage lines) and distribution (piping the power into homes and businesses.)
Generation includes more than 200 power plants ranging from the massive Bruce Nuclear Generating Station – an eight-reactor station that pumps out almost a third of the province's power supply – to tiny solar operations consisting of a few panels. Some generation is handled by government-owned Ontario Power Generation, which runs the Darlington and Pickering nuclear power plants and a slew of hydroelectric facilities. Other generation is done by private companies, including most of the province's gas plants and wind farms. The Bruce plant is also private, run by Bruce Power, a company co-owned by TransCanada Corp., a municipal employees' pension plan and two unions.
Transmission is primarily handled by Hydro One, a government company that is in the process of being privatized. Hydro One's job is to take the power from the various plants and get it to where it's needed. In 2015, Ms. Wynne unveiled a plan to sell 60 per cent of Hydro One in a bid to raise $4-billion to fund her transit plans and $5-billion to pay down debt. So far, the government has sold 30 per cent of the company on the stock market.
In some places, Hydro One handles distribution itself. In others, this task is done by a local utility, such as Toronto Hydro, Horizon Utilities or Hydro Ottawa. Utilities are typically owned by municipal governments, but sometimes have private shareholders as well.
The entire system is overseen by the Independent Electricity System Operator, a government agency that roughly acts as the co-ordinating body to make sure enough power is getting produced and shipped around to meet demand.
The Ontario Energy Board sets rates for electricity twice a year, based on submissions from the various companies and agencies.
The province's Ministry of Energy, meanwhile, makes big-picture decisions about the system and sets overall policy.
What about Ontario Hydro? Isn't that still a thing?
For much of the 20th century, most of the province's electricity generation and transmission were overseen by a single government agency with the snappy name of Hydro-Electric Power Commission of Ontario (better known by its 1970s rebranding as Ontario Hydro). In 1999, the Progressive Conservative government of Mike Harris broke Ontario Hydro into Ontario Power Generation, Hydro One and various other agencies as part of a plan to privatize most of the system. The Tories eventually abandoned their privatization plan, but the new structure remained.
Why is electricity so expensive?
Today's high prices are largely the result of provincial policy decisions made during the 2000s.
When the Ontario Liberal Party came to power in 2003, the province's electricity grid was aging and creaky, and Ontario had to import power to meet its needs. The province was also haunted by the memory of Ontario Hydro's disastrously overbudget nuclear construction projects in the 1980s and 90s. What's more, the Liberals had been elected in part on a promise to close down the province's coal-fired power plants.
So the government went on a building spree, upgrading aging infrastructure and commissioning new natural gas, wind and solar plants to replace the coal plants.
But, wary of the previous cost overruns at Ontario Hydro, the government decided to outsource the work of building and running the new power plants to the private sector. The private sector would be responsible for cost overruns and other construction problems in exchange for 20-year contracts from the province. The contracts essentially guaranteed that the companies would receive a certain amount of revenue – no matter how much electricity their plants produced (though they would be paid more if the province used their electricity).
The first major wave of private power plants was fuelled with natural gas. Later plants were tied to the Green Energy Act, which provided lucrative terms for wind and solar plants in a bid to build a renewable-power industry in the province. One of the most famous deals was a sole-source contract with a Samsung-led consortium, which included locating factories building green-energy equipment in the province.
The cost of all this is passed on to ratepayers in the form of higher electricity bills. Auditor-General Bonnie Lysyk estimates that the "global adjustment charge" – the government's term for the costs in the system above the market rate for electricity – accounts for some 70 per cent of the average electricity bill.
Ultimately, the province built more plants than it actually needed. In 2014, according to the Auditor-General, Ontario had the capacity to produce 30,203 megawatts of power – but only needed 15,959 on an average day. (Even on the busiest day of the year, the province only required 22,774 megawatts.)
At the same time, demand for electricity in the province fell, partly because of the recession and the long-term upheaval in the manufacturing sector and partly because of government efforts to encourage Ontarians to conserve power.
So the province has a massive surplus of generating capacity, but because much of it is tied up in private, 20-year contracts, Ontarians have to pay for all that electricity – whether they need it or not.
In some cases, the province also made the situation worse with political meddling. Ahead of the 2011 election, for instance, then-premier Dalton McGuinty cancelled two unpopular natural-gas plants in Liberal-held ridings in Toronto suburbs and gave the companies new contracts to build plants in other locations – farther from the areas that would need the electricity. As a result, ratepayers ended up on the hook for another $1.1-billion.
And Ontarians are still paying for the nuclear plants Ontario Hydro built in the eighties and nineties. When Ontario Hydro was broken up, its debt was hived off into an item called the "stranded debt," which is being paid down by electricity users.
In 2015, Ms. Lysyk calculated that Ontarians had paid $37-billion more than market price for electricity from 2006 to 2014 and would pay another $133-billion extra by 2032.
Some of this cost was unavoidable: The province has to pay for fixed contracts that guarantee Ontarians have access to a steady supply of power. But there is no doubt, given the vast amount of surplus generating capacity, that the province has overpaid unnecessarily.
What about the privatization of Hydro One? Is that going to make electricity more expensive too?
The short answer: Maybe, but it's debatable.
The long answer: Hydro One hasn't been (semi-)privatized long enough to see what the effect on rates will be.
Opponents of privatization argue that it will ultimately drive up prices because a private company, eager to satisfy shareholders, will be more aggressive than a government agency when it comes to pressuring the Ontario Energy Board into granting rate increases. For example, they argue, a privatized Hydro One could be tempted to defer major infrastructure repairs (replacing aging transmission lines, for instance) in a bid to wring more money out of the company for shareholders, then offer to make the repairs in exchange for a rate increase. A government-owned agency would have a much harder time doing this because of the political backlash from angry consumers. Supporters of privatization, meanwhile, contend that private owners will be more motivated to push for efficiencies within the company, which could then be passed on to consumers.
Either scenario is possible, and it's hard to know which will play out until the company has been privatized for a few years.
In the short term, however, the privatization has become a political problem for the Liberals. Polls show the vast majority of Ontarians believe Hydro One should remain publicly owned, and Liberal insiders concede their opponents, particularly the NDP and the unions, have done an effective job of blaming the privatization for high hydro prices – even though there is currently no connection.
What will happen to prices over time?
Under the government's current projections, electricity prices will keep going up for the foreseeable future. The most recent projection, the 2013 Long-Term Energy Plan, estimated that the average monthly household bill would rise to $210 in 2032 from $138 in 2013 – a 52-per-cent increase. The province is in the middle of preparing the next Long-Term Energy Plan, which will contain an updated projection.
There are a few reasons (besides inflation) electricity prices won't likely be coming down any time soon. For one, there are all those long-term contracts; 20-year deals with private power companies add costs to the system. What's more, the province's nuclear plants are being refurbished over the next 15 years, which will add long-term costs as well.
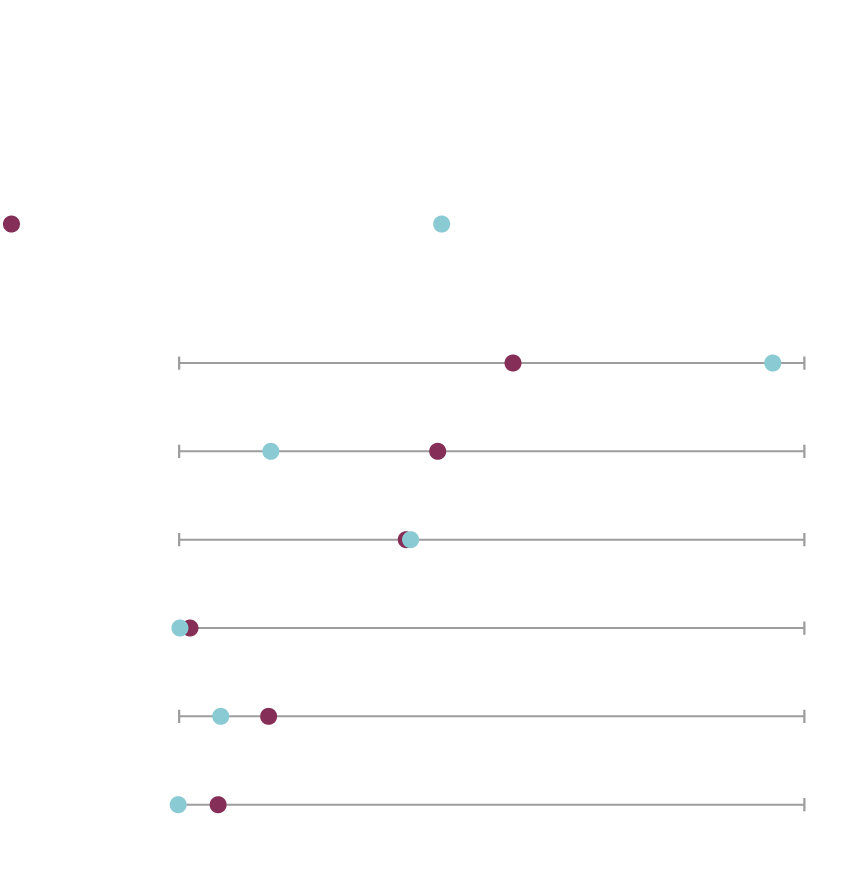
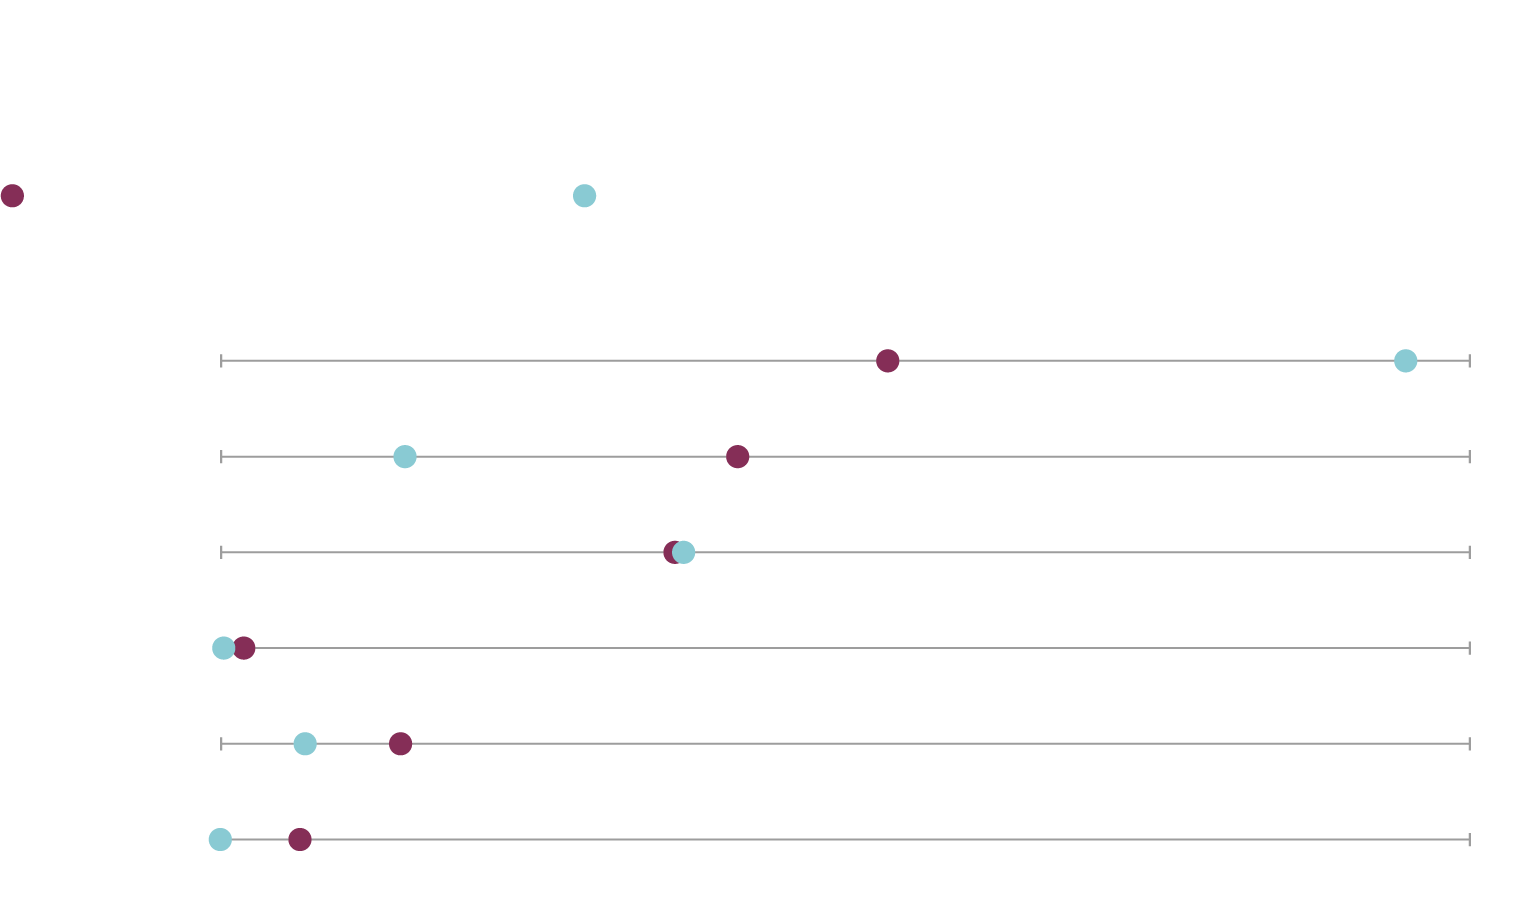
How does Ontario compare with other jurisdictions?
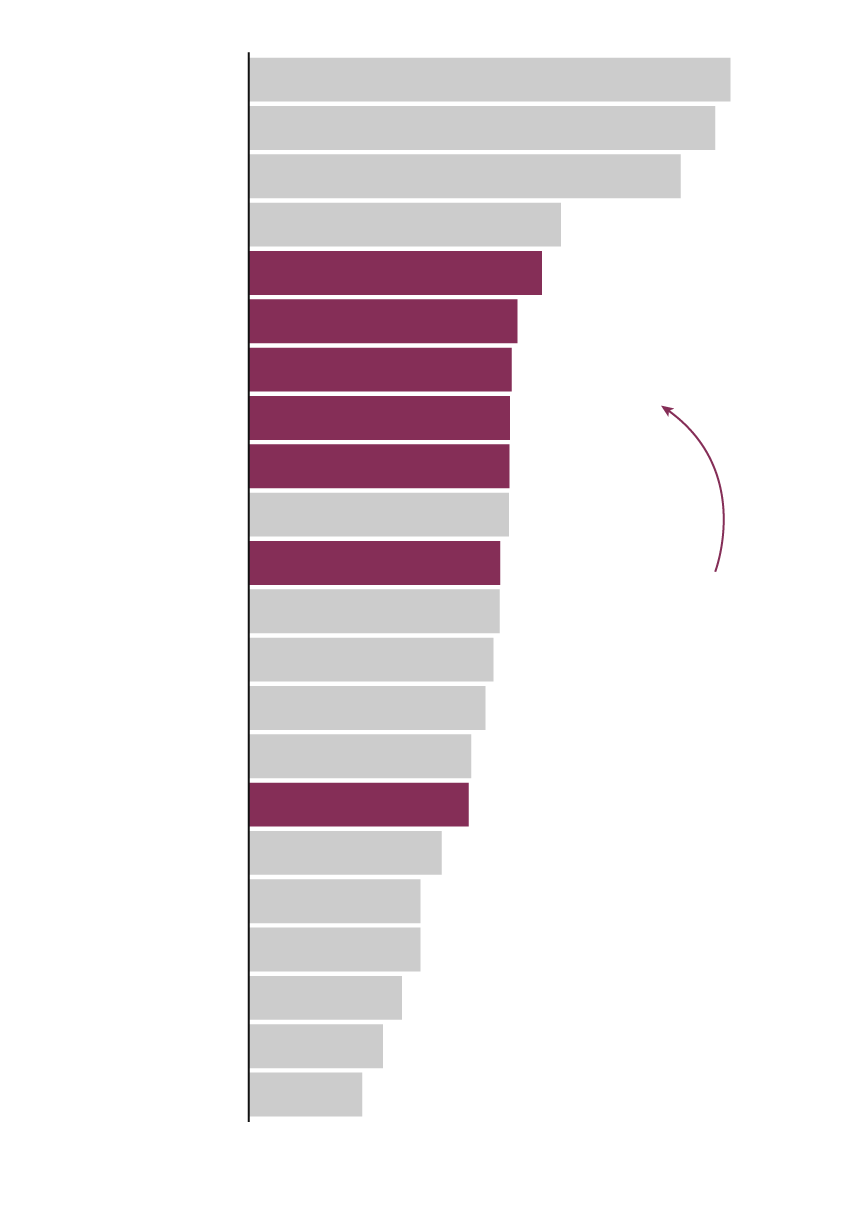
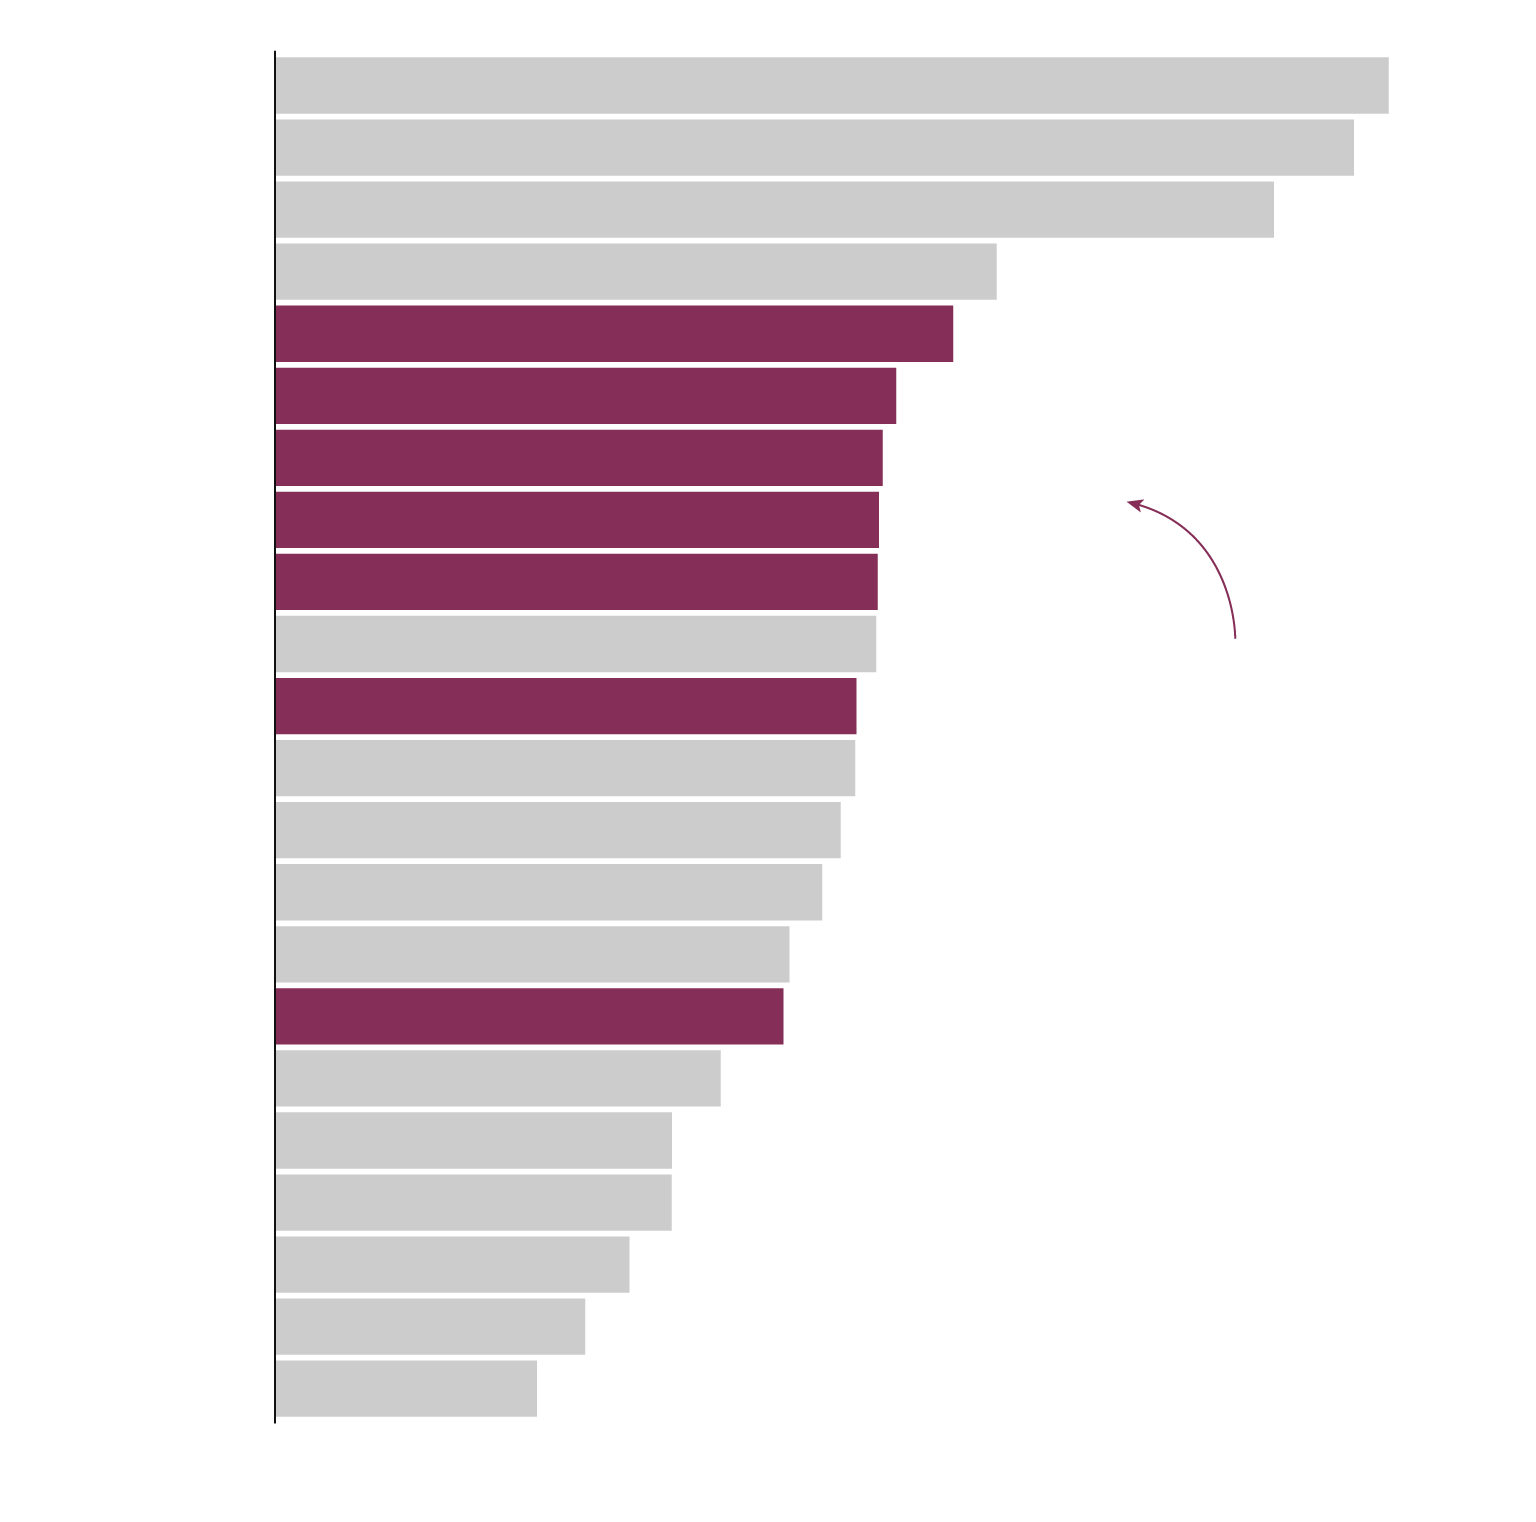
Estimated monthly residential bill before taxes in 2016
San Francisco
$233.87
New York
226.58
Boston
209.78
Detroit
151.53
Toronto
142.40
Median Ontario bill
130.46
Ottawa
127.61
Sudbury
126.83
126.55
London
Charlottetown
126.27
Thunder Bay
122.08
Located in
Ontario
Halifax
121.83
Chicago
118.79
Regina
114.89
Portland
108.04
Cornwall
106.78
St John's
93.61
Calgary
83.35
Edmonton
83.32
Vancouver
74.40
Winnipeg
65.11
55.02
Montreal
Note: Based on 750 kWh of monthly usage. Excludes any applicable taxes. U.S. dollar conversion uses the exchange rate from April 1, 2016.
Estimated monthly residential bill before taxes in 2016
San Francisco
$233.87
New York
226.58
Boston
209.78
151.53
Detroit
Toronto
142.40
Median Ontario bill
130.46
Ottawa
127.61
Sudbury
126.83
126.55
London
Charlottetown
126.27
Located in
Ontario
Thunder Bay
122.08
Halifax
121.83
Chicago
118.79
Regina
114.89
Portland
108.04
Cornwall
106.78
St John's
93.61
Calgary
83.35
Edmonton
83.32
Vancouver
74.40
Winnipeg
65.11
Montreal
55.02
Note: Based on 750 kWh of monthly usage. Excludes any applicable taxes. U.S. dollar conversion uses the exchange rate from April 1, 2016.
Estimated monthly residential bill before taxes in 2016
San Francisco
$233.87
New York
226.58
Boston
209.78
Detroit
151.53
Toronto
142.40
Median Ontario bill
130.46
Ottawa
127.61
Sudbury
126.83
London
126.55
Charlottetown
126.27
Thunder Bay
122.08
Located in
Ontario
Halifax
121.83
Chicago
118.79
Regina
114.89
Portland
108.04
Cornwall
106.78
St John's
93.61
Calgary
83.35
Edmonton
83.32
Vancouver
74.40
Winnipeg
65.11
Montreal
55.02
Note: Based on 750 kWh of monthly usage. Excludes any applicable taxes. U.S. dollar conversion uses the exchange rate from April 1, 2016.
Estimated monthly residential bill before taxes in 2016
San Francisco
$233.87
New York
226.58
Boston
209.78
151.53
Detroit
Toronto
142.40
Median Ontario bill
130.46
Ottawa
127.61
Sudbury
126.83
126.55
London
Charlottetown
126.27
Located in Ontario
Thunder Bay
122.08
Halifax
121.83
Chicago
118.79
Regina
114.89
Portland
108.04
Cornwall
106.78
St John's
93.61
Calgary
83.35
Edmonton
83.32
Vancouver
74.40
Winnipeg
65.11
Montreal
55.02
Note: Based on 750 kWh of monthly usage. Excludes any applicable taxes. U.S. dollar conversion uses the exchange rate from April 1, 2016.
By Canadian standards, Ontario's electricity is ridiculously expensive.
By international standards, it's not so bad.
The province's two Canadian neighbours – Quebec and Manitoba – enjoy electricity prices that are about half what Ontario pays. The main reason: geography. Both Quebec and Manitoba have abundant hydroelectric power, which allows them to generate more than 98 per cent of their electricity from water (compared with 24 per cent in Ontario). This has allowed those provinces to (mostly) avoid both the costly and complicated process of building nuclear plants, which Ontario undertook from the 1960s to the 90s, and the phase-out of coal-fired powered plants that dominated the 2000s.
Other provinces also generally have cheaper electricity than Ontario for a variety of reasons. For one, no other province has ever undertaken a nuclear build on the scale Ontario has (New Brunswick is the only other province that uses nuclear power; Quebec once had a single, relatively small nuclear plant, which shut down in 2012). Some other provinces, notably Alberta and Saskatchewan, get most of their electricity from coal-fired power plants (although Alberta is looking to replace coal with natural gas, wind and solar).
Internationally, however, Ontario's price situation looks a lot better. Electricity in New York is more expensive, despite a fairly similar supply mix – the state uses nuclear power, though somewhat less of it; natural gas, though somewhat more of it; and continues to burn coal. In Europe, prices are even higher, with France and Britain both paying more than Ontario; and in the case of Germany, Italy and Denmark, prices are double or more what they are in Ontario.
What is the government doing about it? What can be done?
In the past four years, Ms. Wynne's government has made several changes to the system in a bid to ease price increases.
The most significant was a decision in 2013 to stop building more nuclear reactors. The same year, the province also renegotiated the deal for wind and solar power from the consortium led by Samsung, which took $3.7-billion in costs out of the system by scaling back the amount of electricity the consortium would produce.
The government has also taken smaller actions, including buying hydroelectric power from Quebec at a lower price than it would have cost to generate the same power from natural-gas plants, saving about $70-million over seven years.
Most recently, Ms. Wynne went for the quicker fix of slashing bills by 8 per cent with a taxpayer subsidy. But the subsidy is controversial. For one thing, because taxpayers and ratepayers largely overlap, it effectively asks most Ontarians to subsidize their own power bills – to the tune of about $1-billion a year; for another, it's regressive, as it disproportionately helps wealthier people with larger homes that use a lot of electricity.
There is relatively little the government can do to lower rates through more lasting, structural means, mostly because the Liberals have tied up so much of the system in 20-year contracts. Progressive Conservative Leader Patrick Brown, however, has promised to take a closer look at the deals to see if any can be renegotiated if and when he becomes premier.
Other possible solutions face problems of their own. While some politicians, particularly in the NDP, advocate buying more hydroelectricity from Quebec instead of refurbishing the province's nuclear plants, doing so would require a lot of money to upgrade the transmission infrastructure.
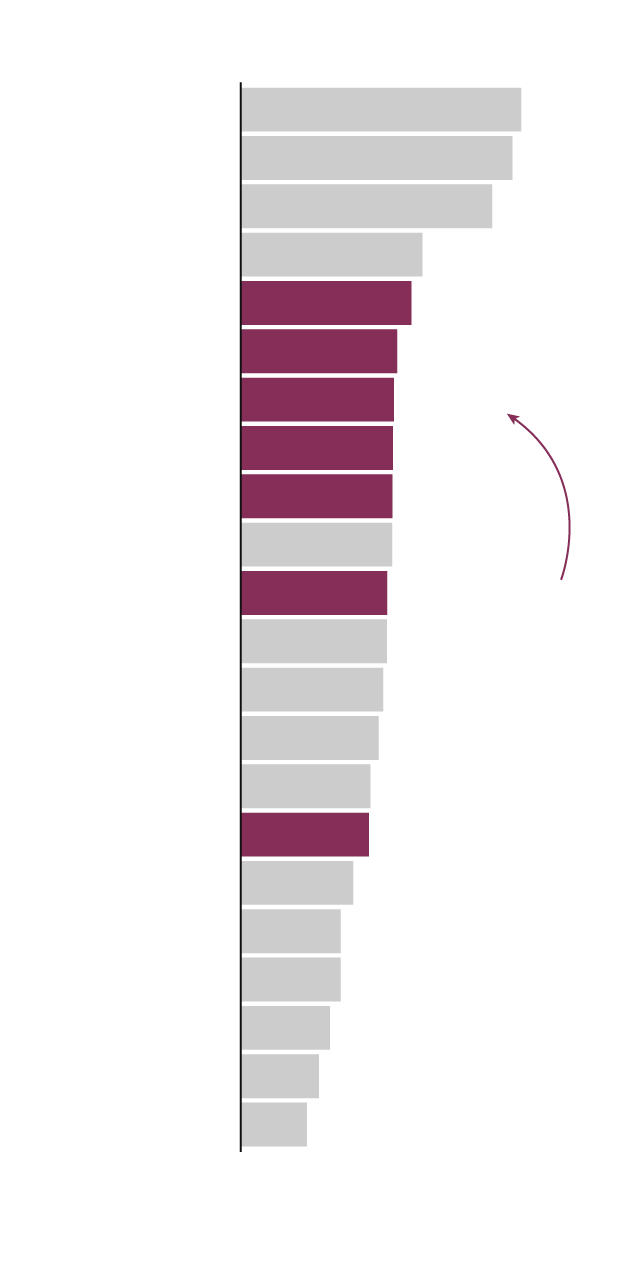
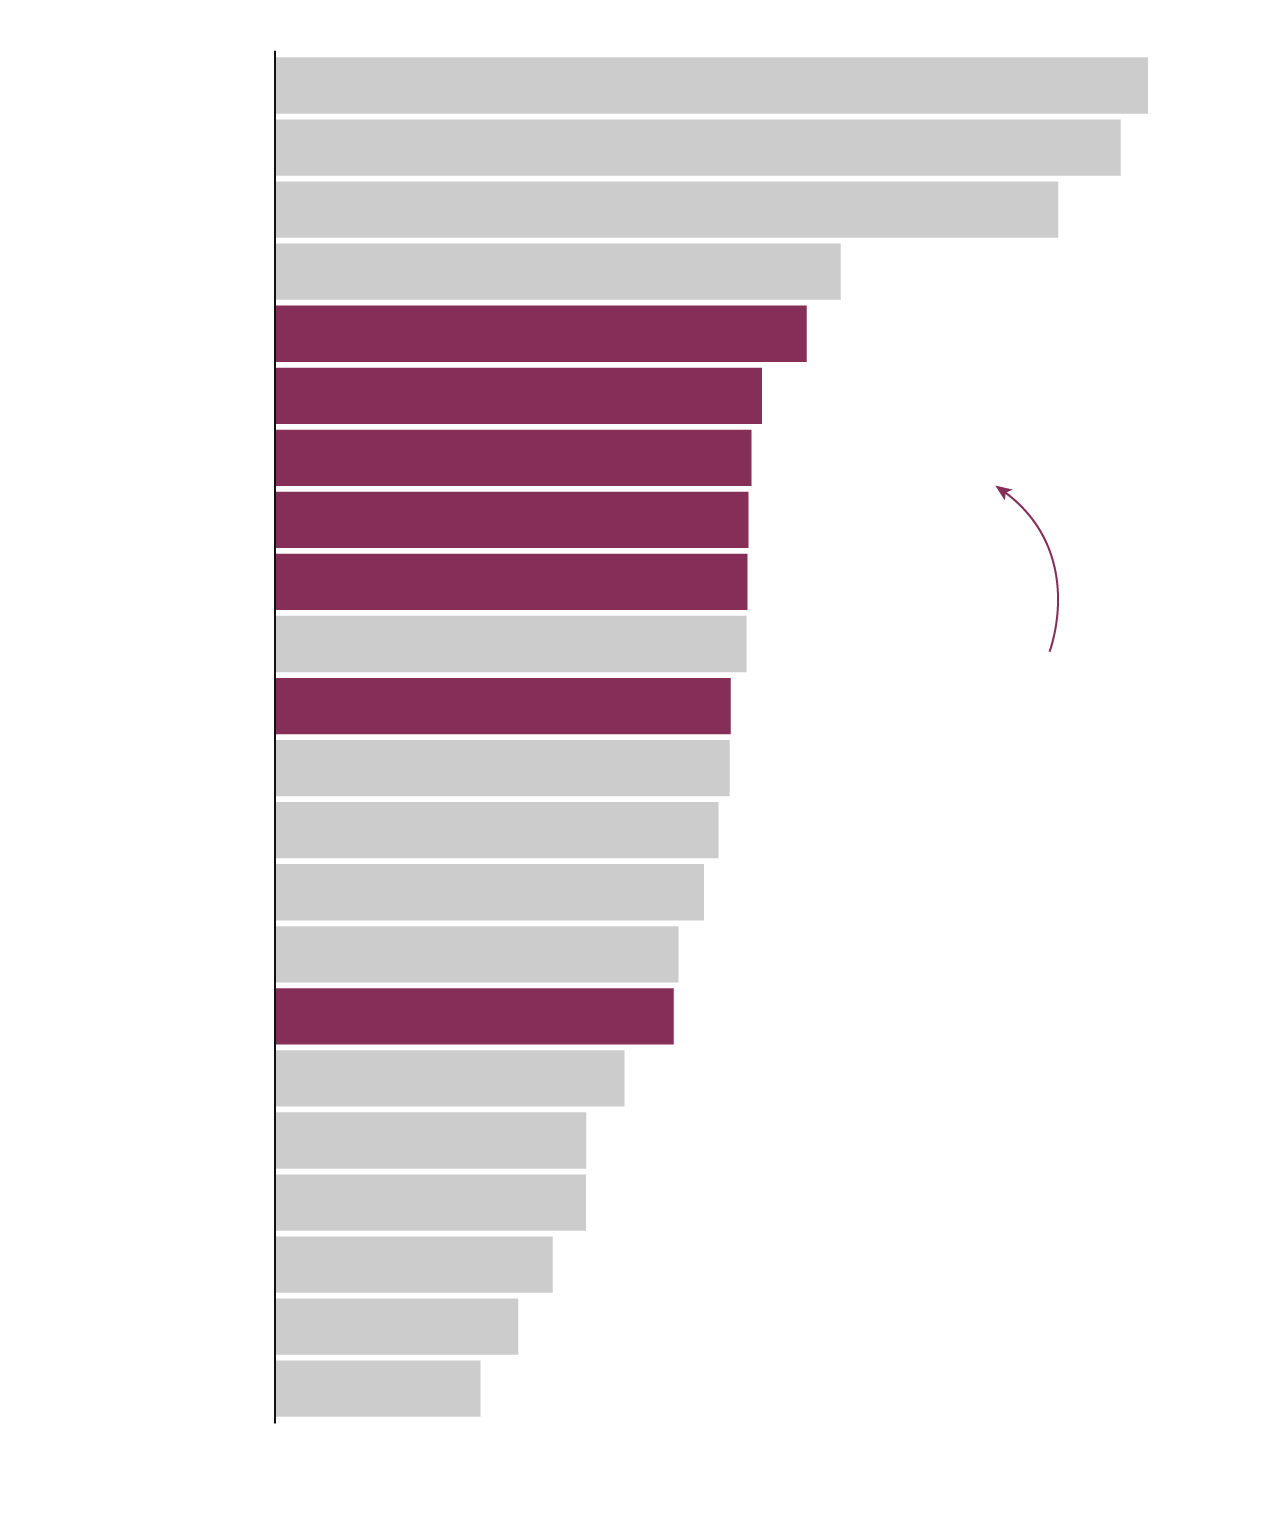
What are the political ramifications here?
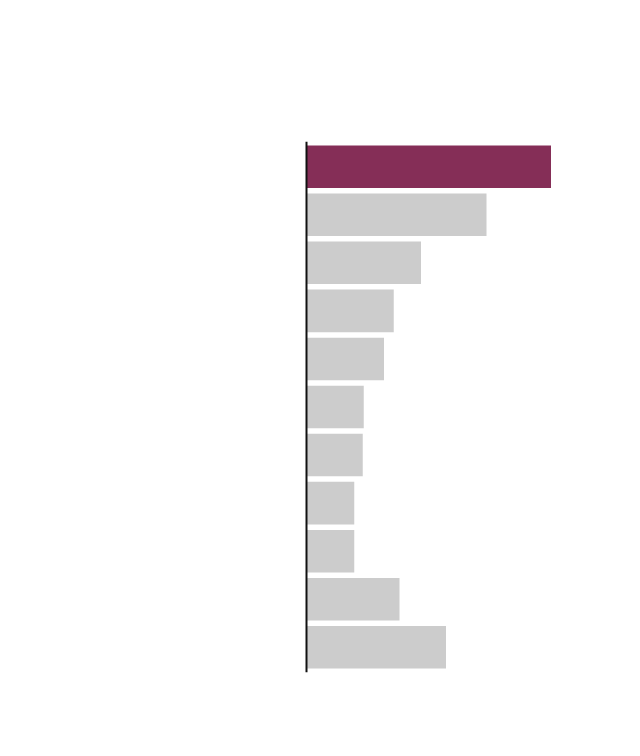
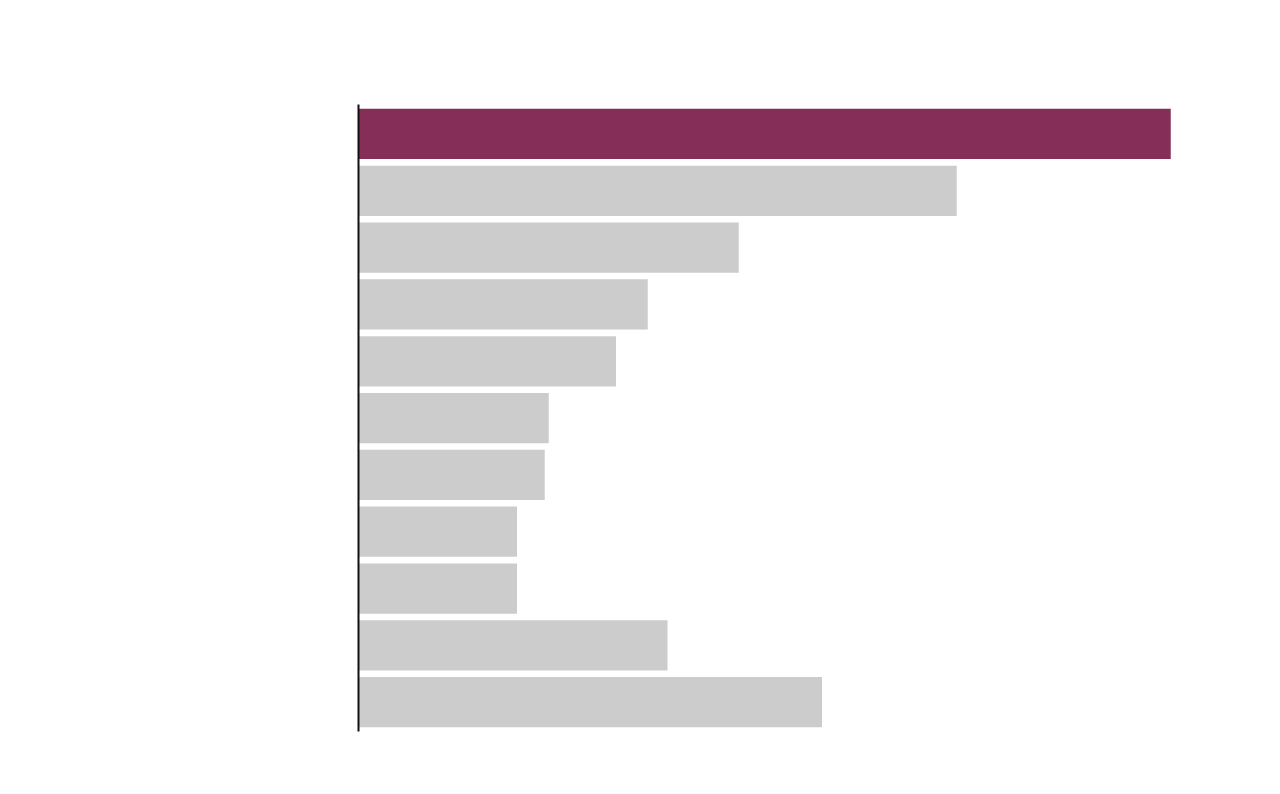
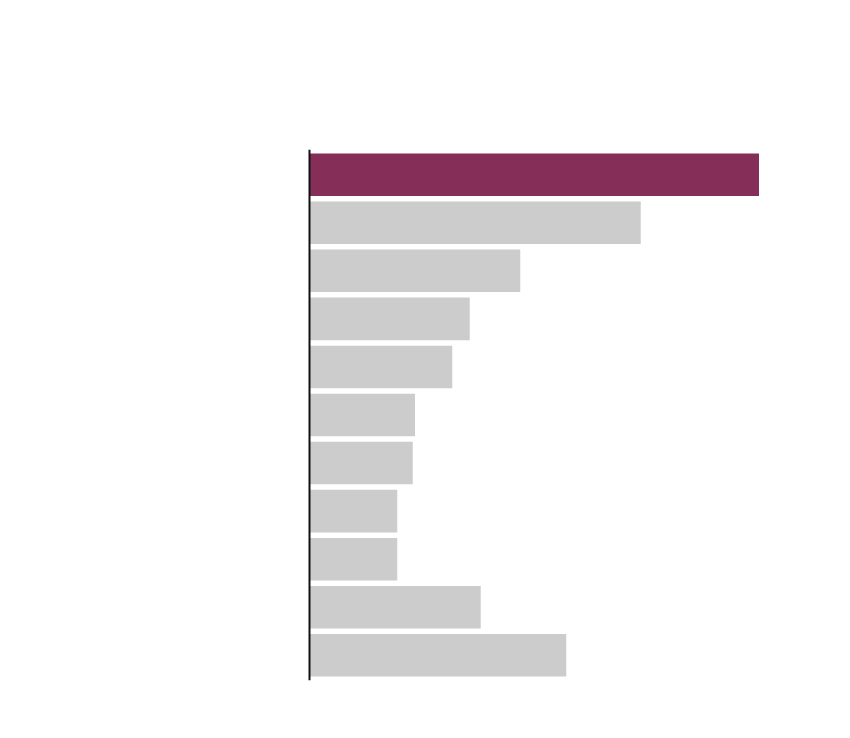
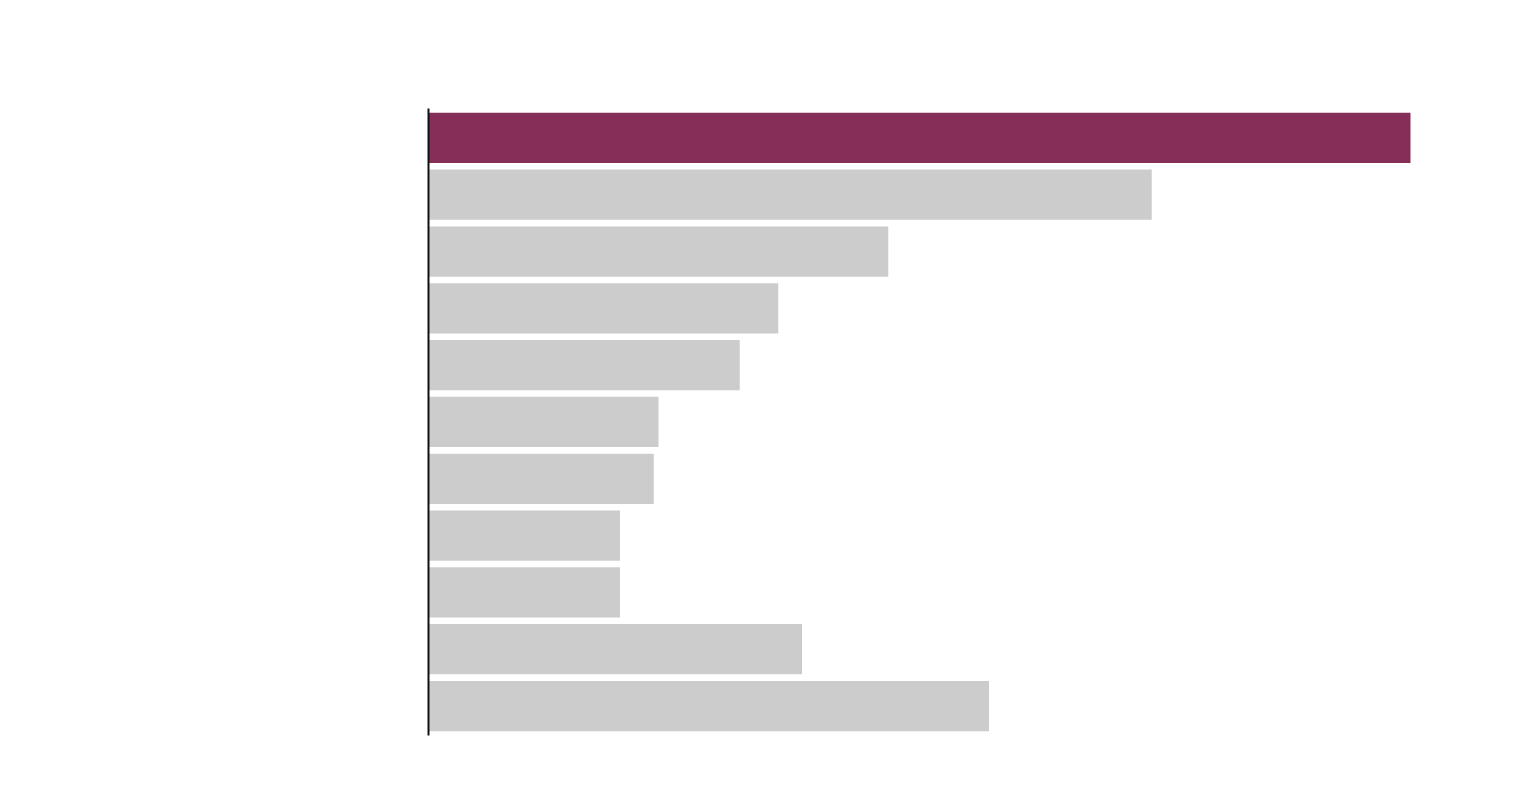
Survey question: What is your most important provincial issue of concern?
Random telephone survey of 500 Ontarians, conducted Nov. 15 to Nov. 19, 2016
Hydro rates
20.5%
Healthcare
15.1
Jobs and the economy
9.6
High taxes
7.3
Education
6.5
Infrastructure investments
4.8
Change the government
4.7
The environment
4.0
Deficit and debt
4.0
Other
7.8
Unsure
11.7
Accurate to within 4.4 percentage points, 19 times out of 20.
Survey question: What is your most important provincial issue of concern?
Random telephone survey of 500 Ontarians, conducted Nov. 15 to Nov. 19, 2016
20.5%
Hydro rates
15.1
Healthcare
Jobs and the economy
9.6
High taxes
7.3
Education
6.5
Infrastructure investments
4.8
Change the government
4.7
The environment
4.0
Deficit and debt
4.0
Other
7.8
Unsure
11.7
Accurate to within 4.4 percentage points, 19 times out of 20.
Electricity prices seem to have reached a tipping point in the public's consciousness over the past couple of years. A poll last month by Nanos Research showed that, astonishingly, more voters named electricity as their top issue, unprompted, than any other public-policy concern – beating out perennial favourites health care, jobs and taxes.
The governing Liberals have trailed the opposition PCs in the polls for two years, and Ms. Wynne's approval rating has sunk to record lows (as far down as 13 per cent, according to one Forum poll). There may be multiple reasons for that – a string of ethics scandals certainly hasn't helped – but the Liberals themselves are convinced that electricity prices are killing them at the polls.
Follow Adrian Morrow on Twitter: @AdrianMorrow
MORE FROM THE GLOBE AND MAIL