
Rob Dobi/The Globe and Mail
Table of contents • Suicide prevention • People with disabilities • First-time home buyers • Youth in segregation • First Nations population • Energy poverty
More reading • Other suggestions • How you can help • The list of gaps
From youth in segregation to jobless rates among people with disabilities, The Globe and Mail’s data-gaps project generated hundreds of responses from readers across the country on gaps they identified and want to see fixed.
The paper’s continuing data-gap series includes an online tool that lets readers report data gaps they have encountered in their work or research.
It received more than 350 submissions, and they came from every province, with academics, analysts, health-care workers, students and business consultants citing more than 400 gaps, from refugee outcomes to the gig economy and weather patterns.
The Globe’s series identified key areas in Canada in which public data are lacking, such as children’s vaccination rates, eviction rates and measures of how far people drive. The country’s data regime is fragmented for a host of reasons, from outdated legislation to a lack of standardization among provinces, and an aversion to collecting some types of data, such as on race or ethnicity.
The federal government pledged in its recent budget to fill some gaps, but Canada’s data system remains a patchwork. And many of the funding boosts in the budget, at a cost of billions of dollars, are going to areas – from skills training to suicide prevention – where it is hard to pinpoint the precise needs because data are lacking. Thus it is unclear whether money is being targeted effectively and whether these programs are having an impact.
Some of the suggestions from readers that The Globe verified as gaps show we still cannot quantify some basic issues. Here are six suggestions from readers on gaps (meaning available data are not comparable nationally or by province, or are not timely, complete or accessible) – and why they matter:
1. In suicide-prevention efforts, do we have a clear picture of suicide rates among different professions or by ethnicity?
Some of Canada’s data gaps lead the federal government to budget blindly, spending tens of millions of dollars without knowing the full scope of the problem it’s trying to fix or how best to target the money.
This year’s federal budget included $25-million over five years for a pan-Canadian suicide-prevention service, for example.
But experts in the field say we have a poor grasp of which Canadians take their own lives, making it harder to prevent such tragedies, even with more funding. The suicide rates for different professions, and different ethnic groups, are particular blind spots.
Veda Rajole runs Frontline Healthcare, an Ottawa-based non-profit that will soon provide health services for first responders and their families. He knows operational stress and mental-health issues put his clients at a higher risk of suicide. But in Canada, it’s virtually impossible for him to learn the suicide rate for first-responders such as police and firefighters.
“Having worked in this space for the last five years … I still can’t point out that number,” he said. “It’s a vital number to get a hold of.”
Better figures would accomplish two things, Mr. Rajole says. They would alert certain professions to mental-health pitfalls within their ranks, and inspire governments to provide more funding for specialized suicide-prevention programs tailored to certain fields.
“When you have these stats in place, that will justify [those] costs,” Mr. Rajole said.
That’s exactly what has happened in Australia recently, according to Mara Grunau, executive director of Canada’s Centre for Suicide Prevention.
About a decade ago, data gathered by unions showed that construction workers in that country had an unusually high suicide rate – as many as one in five.
That stark figure prompted the creation of a national charity called Mates in Construction, which aims to raise awareness about mental-health issues in a profession plagued by injury, drug addiction and a culture of masculine silence.
Now, the program is well-established, with 20 per cent of its funding coming from government and 80 per cent from industry. It involves peer support on work sites, including regular suicide-prevention talks and paid training for workers who want to help colleagues in distress. (Stickers on their hard hats identify those in the peer-support network.)
The program is seen as an international success story – and had its roots in the kinds of data that are inaccessible in Canada.
Recent research in the United States has also found that suicide is on the rise among African-American boys – a finding made possible by routine reporting of ethnicity on U.S. death records. No Canadian province requires coroners to note ethnicity, so we have no idea if similarly disturbing trends are taking hold in Canada.
Suggestion: Veda Rajole, Ottawa
2. What is the current jobless rate among people with disabilities, and how are they faring in the labour market?
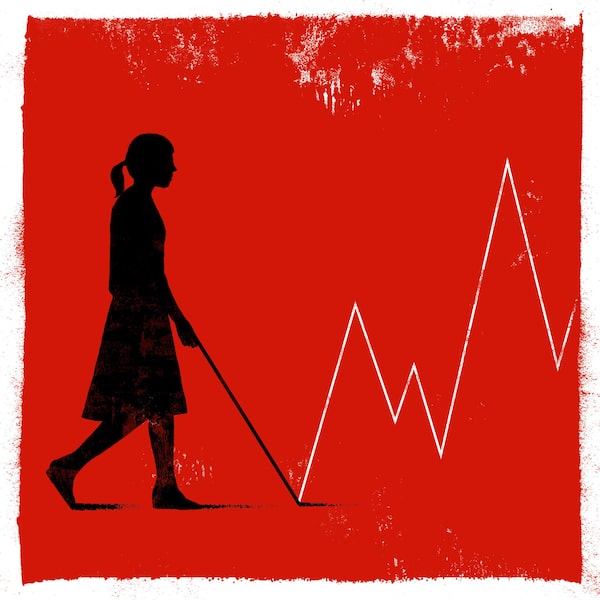
Rob Dobi/The Globe and Mail
Canada’s jobless rate has been near record lows for more than a year – but it’s difficult to tell whether the tight labour market is spurring employers to hire people with disabilities.
It’s a large demographic – across the country, one in five working-age adult Canadians has a disability and, historically, many have faced barriers to employment.
In the United States, the evidence is clear: More Americans with disabilities are joining or re-joining the work force in a tight labour market. The United States publishes the average annual rate among those with disabilities every year, which gives a clear picture of trends; its numbers show the average monthly jobless rate among people with disabilities fell to 8 per cent last year from 12.5 per cent in 2014.
Canada, by contrast, has no such annual stats to tell whether labour-market outcomes among those with disabilities are improving or deteriorating.
“Should we be measuring this? Absolutely,” says Mahadeo Sukhai, head of research and chief accessibility officer at the Canadian National Institute for the Blind, who has sight loss. “If we are to live up to our national principles around equity and diversity, we have to measure it.”
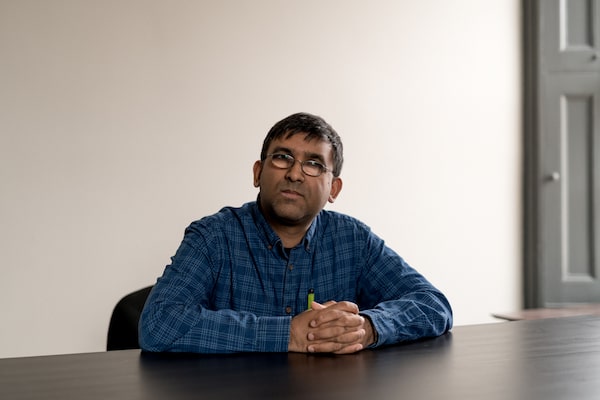
Dr. Mahadeo Sukhai.JOHNNY C.Y. LAM/The Globe and Mail
That lack of data affects the ability to influence programs or effectively advocate, said Dr. Sukhai, who has a PhD in cancer genetics.
“When we go to funders, they would love to see data; but if we don’t have data, then it becomes difficult to make an argument.”
Employment and a steady pay cheque are crucial as nearly a third of working-age adults with severe disabilities live in poverty, compared with 10 per cent of those without disabilities, Statistics Canada’s 2017 survey shows. Having a job can improve health outcomes, reduce the need for disability payments and give a sense of fulfillment; for employers, that untapped pool of talent could help alleviate labour shortages.
Statscan does have jobless rates and participation rates by disability, although these date to its 2017 survey on disabilities, are not comparable to the agency’s previous survey, in 2012, and must be ordered as a customized tabulation. The agency collects labour-market information on people with disabilities every five years through the census and via its disability survey, and says it has no current plans to increase the frequency of such data collection.
Dr. Sukhai says the data dearth could be addressed by simply adding questions to regular surveys, such as the monthly labour-force and graduate surveys.
“What gets measured gets paid attention to,” he says.
Suggestion: Margaret Parlor, Ottawa
3. Just who are first-time home buyers in Canada?

Rob Dobi/The Globe and Mail
This year’s federal budget also contained rich incentives for first-time home buyers, to the tune of $1.25-billion over three years. But again, Canadians have little idea of the demographics for first-time home buyers, whether their numbers are growing or shrinking, or where they live.
David Foster, spokesman for the Canadian Home Builders’ Association, is blunt about the problem.
“We don’t keep statistics on first-time buyers,” he said. “It’s still a real blind spot. It kind of bedevils things.”
Again, shards of information suggest part of the picture. The Canada Mortgage and Housing Corp. conducts home-buyer surveys that capture some numbers about novices in the market, but the sample size is small and unrepresentative. The Canada Revenue Agency has some data, too, culled from first-time home buyers who apply for a tax credit, but not all do.
Then there’s what Mr. Foster calls “shadow data,” such as the rate of mortgages that are insured, an instrument that usually goes to first-time buyers and is down dramatically in the past few years.
But neither of those indicators tells the basic fact of how many people are buying homes for the first time and where. If the number was in free fall, that might suggest even more federal assistance was needed – or vice versa. Knowing local variations in the first-time buyer numbers could help target the money to where it’s needed most.
The implications of the missing data go beyond the question of whether to give first-time buyers a leg up, he points out. When young people are not buying homes, it generally means they’re renting instead, which can cause rents to increase, and limit housing options for lower-income groups. Data showing a decline in first-time home buyers might be an argument for building more rental housing in the short-term.
A box to tick on the transaction papers asking buyers if this is their first time purchasing a home would help answer these questions, he notes.
“It’s amazing we don’t know with any precision in a given year how many folks move from rental to ownership,” Mr. Foster said. “It’s not like it’s difficult to collect the data.”
Suggestion: David Clattenburg, Oakville, Ont.
4. How many incarcerated youth are placed in segregation?

Rob Dobi/The Globe and Mail
Canada is missing swathes of information about young people in the justice system – such as the number who are in segregation (also called secure isolation, or solitary confinement).
More than 7,600 young people aged 12 to 17 were in correctional services on an average day in 2016-17, according to Statscan (even this number is a fragment; it excludes Quebec, Nova Scotia and New Brunswick due to the unavailability of data).
But it’s difficult to know how those youth are faring within those facilities, and whether some provinces are more apt to put them in solitary or use restraining devices than others, said Alan Markwart, British Columbia’s deputy representative for children and youth.
“We’re dealing with young people with quite a disadvantage in the first place. And then to deprive them of any kind of mental stimulation and social contact for any prolonged period of time is probably not effective and can be quite detrimental.”
The limited data available are troubling – a Manitoba study this year found 957 incidents of segregation in the province in a recent year, citing one youth who was kept in solitary for 400 straight days “in a cell smaller than a parking stall.”
“We certainly have very significant gaps in [youth justice] data,” says Nicholas Bala, a law professor at Queen’s University and global expert in youth justice. This includes data on the lengths of sentences youth receive, how many get adult-like sentences and the number in segregation. “It makes policy making difficult,” he said.
Suggestion: Deb Chaboyer, Winnipeg
5. What is the First Nations population?
With the exception of the census, Statistics Canada excludes the on-reserve population from all of its household surveys – so for health, the labour force, disability, financial security and even its Aboriginal Peoples Survey, this population is not included.
As a result, details on well-being in Indigenous communities are another data void. Data on economic development are “almost non-existent,” while Statscan “has never published measures of First Nation poverty,” the Assembly of First Nations said in an e-mailed statement.
Even basic population counts are problematic, the AFN added, noting that neither the census – which still doesn’t get complete participation from all communities – “nor Indigenous and Northern Affairs Canada’s Indian Registry (because of methodology problems) are reliable counts of status First Nation people.”
Some groups, such as the First Nations Information Governance Centre (FNIGC), are working to fill data voids (particularly in health), but key information gaps hinder local decision-making.
First Nations communities “have been essentially living in what I call information poverty – and because we have not had information at the community level, at the nation level, we have not been able to make evidence-based decisions,” said Bonnie Healy, chair of the governance centre’s board and executive director of the regional Alberta branch of the organization.
Ms. Healy, too, has found problems in population counts. In Alberta, “there are some major inaccuracies” in the federal Indian Registry due to a lack of a relationship between First Nations and the province’s vital statistics office, which keeps birth and death records, she says. This under-count carries a range of consequences, including its effect on funding formulas.
Suggestion: Tamar Myers, Toronto
6. Who is living in ‘energy poverty’?

Rob Dobi/The Globe and Mail
In Canada, it’s hard to piece together a picture of who lives in energy poverty – those who have trouble paying their energy bills or keeping their homes at comfortable temperatures – and where. Statscan’s Households and the Environment Survey captures some suggestive information, such as energy consumption by household type and income bracket. And the census asks about annual heating payments for electricity and other fuel types.
But energy poverty is tricky to measure because it often doesn’t align neatly with income levels: In fact, poor families living in small public-housing apartments sometimes have fewer energy-cost pressures than middle-income people living in big drafty houses.
The sheer amount a household spends on energy doesn’t necessarily indicate it is energy poor, notes Maryam Rezaei, author of the first academic study of Canadian energy poverty and a senior manager at Community Power, a firm that works on energy issues with Indigenous communities. Often, a more subjective standard is needed.
“One of the challenges of identifying people living in energy poverty is … their homes might be cold, they might be living in horrible, horrible conditions, but they’re not spending a lot,” she said.
The European Union gets around some of these problems with an annual survey that asks respondents if they are able to keep their home adequately warm, if they are in arrears on utility bills, and if they have a leaky roof or other home repair needs. Although there is no common European definition of “energy poverty,” the survey gives researchers a lot of data to work with.
Dr. Rezaei would like similar questions added to future censuses.
Suggestion: Allison Ashcroft, Victoria
With a report from Jeremy Agius
In their own words: Globe readers highlight other data gaps
An important gap in data to me is the true number of homeless Canadian veterans year to year. I work with homeless veterans and there seems to be more than when I first started eight years ago. There would be a shaming if Canadians knew true data on what happens to soldiers when they come home. … Soldiers are a proud group that do not seek help and many are missed. … The absence of true information is perpetuating the myth that they get the help they need. They do not. I say we count them and trend these data in order to effect a response.
Deborah Morrow, president, Verity Health Resources Inc., Vancouver
I have been collecting and comparing urban transportation-related data on cities worldwide for 40 years. Canadian cities are very problematic for most of that data. … For example, what is the modal split for all daily trips in metro regions? How many vehicle kilometres by car are travelled per year? What is the total length of roads and particularly freeways in Canadian metro regions? What about transit data? What levels of service are provided, how much transit do people use in Canadian cities, etc.? The list is quite long. And in Canada, it is mostly rather tortured trying to extract such data.
Jeffrey Kenworthy, professor in sustainable cities, The Curtin University Sustainability Policy Institute, Curtin University of Technology, Perth, Western Australia
How has data collection on Indigenous peoples evolved (if it has) since it was first collected? Have any correlations been run between Indigenous peoples being taken away by the foster care system and then ending up homeless? What about Indigenous data sovereignty? How can First Nations communities and/or organizations access the historical records for their communities/organizations? Are there any cross-tab[ulation]s with Indigenous Services Canada data? [Employment and Social Development Canada]'s homeless counts data? Can there be? There is so much more we need to know about ourselves and our communities that the federal government has collected on us but considers it their data … We can no longer allow the government to collect data on us as Indigenous Peoples and withhold it from us. It’s about data sovereignty.
Luugigyoo Patrick Reid Stewart, PhD, member of the Nisga’a Nation and chair of the Provincial Indigenous Homelessness Committee, Vancouver
We lack data on some key indicators of innovation. One measure of the efficacy of university and private-sector research would be to track the numbers of patents awarded to university researchers, companies, government and independent citizens over time. In other words, “What are the fractions of patents granted to universities, companies, government and independent entities?”
Ishwar Puri, dean of engineering at McMaster University, Hamilton
What portion of the Canadian population identifies as two-spirit, lesbian, gay, bisexual, trans, queer or otherwise identifies or expresses gender and sexual diversity? The census does not ask about this, so we don’t have good information on the representation of 2SLGBTQ+ people across the country or about their employment, education and more. We need to better understand the experiences of 2SLGBTQ+ people to better meet the needs of this community in Canada.
Tamar Myers, director of research, planning and assessment in the office of the vice-president, equity and community inclusion at Ryerson University, Toronto
We do not have accurate, comprehensive data on rates of food-borne illness (and deaths from contaminated food) in Canada each year, including the causative agents or the food responsible. We use estimates that are extrapolated from data published by the Centres for Disease Control in the United States and from data trends in Britain and Australia. Most frequently used Health Canada (the Public Health Agency of Canada) data have been generated by expert elicitation (expert opinion) “validated” after publication in peer-reviewed scientific journals.
Rick Holley, distinguished emeritus professor, department of food science and human nutrition, University of Manitoba, Winnipeg
Editor’s note: (May 7, 2019) An earlier version of this article incorrectly said more than 7,600 young people aged 12 to 17 were in custody on an average day in 2016-17. In fact, that number was in correctional services which includes both custody and community supervision. This version has been corrected.
The investigation: How you can help
The data gaps uncovered so far
The Globe and Mail has uncovered myriad data deficits, culled from dozens of interviews, research reports, government documents, international searches and feedback from our own newsroom. Here’s a list of what we found, which we’ll be adding to as the investigation continues.
 Tavia Grant
 Eric Andrew-Gee
Globe and Mail reporters will continue to collect and report on data gaps that affect Canadians. If you have one in mind, please submit a description of it. Data gaps will be investigated by our reporters before they are published.